Groel Protein
(All numbering and residues are taken from first PDB file)
![]()
![]()
Bending Residue Dihedral Analysis
Residue
iResidue
i+1Distance of hinge axis to residue i in
(A) Distance of hinge axis to residue i in
(A) Change in
(deg) Change in
(deg) Angle of psi(i) axis to hinge axis
(deg) Angle of psi(i) axis to hinge axis
(deg) Percentage Progress
MET-69
GLY-70
33.0
33.1
-10.7
-4.2
86.6
89.3
-107.1
GLY-70
ALA-71
29.7
30.0
20.0
-12.8
60.8
54.8
106.8
ALA-71
GLN-72
28.7
28.9
5.2
-1.7
118.1
120.3
-126.2

Graph shows rotational transition at bending residues and can be used
to identify hinge bending residues.
Probably only informative for interdomain rotations greater than 20 degrees
Residue
iResidue
i+1Distance of hinge axis to residue i in
(A) Distance of hinge axis to residue i in
(A) Change in
(deg) Change in
(deg) Angle of psi(i) axis to hinge axis
(deg) Angle of psi(i) axis to hinge axis
(deg) Percentage Progress
MET-73
VAL-74
27.9
27.9
-5.3
1.3
74.0
70.7
23.6
VAL-74
LYS-75
24.6
24.7
19.8
-10.6
115.6
118.5
-232.4
LYS-75
GLU-76
25.6
25.5
22.0
0.2
42.5
46.3
339.2
GLU-76
VAL-77
26.6
25.3
16.7
14.4
63.5
85.4
176.2
VAL-77
ALA-78
23.3
21.5
-10.1
-2.8
54.1
51.7
168.4
ALA-78
SER-79
21.0
21.4
-1.1
-15.8
81.3
113.4
4.4
SER-79
LYS-80
23.1
24.0
-10.0
-7.7
136.7
143.7
-567.8
LYS-80
ALA-81
22.3
22.4
-15.2
8.7
79.2
74.2
112.6
ALA-81
ASN-82
18.9
19.1
6.8
-10.9
124.8
118.1
35.5
ASN-82
ASP-83
20.6
21.4
-1.1
-7.9
125.1
124.8
-116.1
ASP-83
ALA-84
23.2
23.6
11.7
-7.1
56.0
59.6
101.7
ALA-84
ALA-85
20.6
20.6
10.0
-14.7
119.7
122.7
76.2
ALA-85
GLY-86
18.3
18.6
-14.7
-19.2
24.5
23.0
983.2

Graph shows rotational transition at bending residues and can be used
to identify hinge bending residues.
Probably only informative for interdomain rotations greater than 20 degrees
Residue
iResidue
i+1Distance of hinge axis to residue i in
(A) Distance of hinge axis to residue i in
(A) Change in
(deg) Change in
(deg) Angle of psi(i) axis to hinge axis
(deg) Angle of psi(i) axis to hinge axis
(deg) Percentage Progress
THR-90
THR-91
17.6
16.9
-6.1
13.8
63.5
63.2
-167.0
THR-91
ALA-92
14.3
13.7
-8.3
0.2
37.8
33.6
152.7
ALA-92
THR-93
16.4
15.7
-0.2
-5.3
106.4
101.1
-26.7
THR-93
VAL-94
18.9
18.4
2.7
-0.2
76.2
76.9
175.1
VAL-94
LEU-95
16.6
16.2
5.0
-3.0
144.7
143.9
-170.2
LEU-95
ALA-96
15.3
14.8
-4.0
10.3
62.9
60.4
-137.4

Graph shows rotational transition at bending residues and can be used
to identify hinge bending residues.
Probably only informative for interdomain rotations greater than 20 degrees
Residue
iResidue
i+1Distance of hinge axis to residue i in
(A) Distance of hinge axis to residue i in
(A) Change in
(deg) Change in
(deg) Angle of psi(i) axis to hinge axis
(deg) Angle of psi(i) axis to hinge axis
(deg) Percentage Progress
GLN-97
ALA-98
20.3
20.0
-12.9
13.5
104.7
105.2
146.6
ALA-98
ILE-99
18.1
17.8
0.4
-3.7
20.9
15.9
-171.9
ILE-99
ILE-100
18.3
18.2
1.3
0.2
85.0
80.7
48.8
ILE-100
THR-101
22.0
21.9
-5.5
9.5
66.3
67.4
101.9
THR-101
GLU-102
23.1
22.8
-7.7
-2.5
124.2
123.0
-221.0
GLU-102
GLY-103
22.0
21.8
5.7
-5.4
21.1
19.9
16.5
GLY-103
LEU-104
22.6
22.4
-2.5
3.8
89.8
93.2
188.1
GLY-103
LEU-104
22.6
22.4
-2.5
3.8
89.8
93.2
188.1

Graph shows rotational transition at bending residues and can be used
to identify hinge bending residues.
Probably only informative for interdomain rotations greater than 20 degrees
Residue
iResidue
i+1Distance of hinge axis to residue i in
(A) Distance of hinge axis to residue i in
(A) Change in
(deg) Change in
(deg) Angle of psi(i) axis to hinge axis
(deg) Angle of psi(i) axis to hinge axis
(deg) Percentage Progress
GLY-103
LEU-104
22.6
22.4
-2.5
3.8
89.8
93.2
188.1
GLY-103
LEU-104
22.6
22.4
-2.5
3.8
89.8
93.2
188.1
LEU-104
LYS-105
26.2
26.1
-0.9
-3.3
83.3
76.6
-106.9
LYS-105
ALA-106
26.7
26.6
12.4
-5.6
31.2
33.4
118.7

Graph shows rotational transition at bending residues and can be used
to identify hinge bending residues.
Probably only informative for interdomain rotations greater than 20 degrees
Residue
iResidue
i+1Distance of hinge axis to residue i in
(A) Distance of hinge axis to residue i in
(A) Change in
(deg) Change in
(deg) Angle of psi(i) axis to hinge axis
(deg) Angle of psi(i) axis to hinge axis
(deg) Percentage Progress
LEU-134
SER-135
5.1
5.3
-3.4
3.5
113.3
115.6
34.7
SER-135
VAL-136
8.0
8.0
-4.4
3.7
99.3
97.0
171.1
VAL-136
PRO-137
11.1
10.9
-2.2
3.7
80.7
81.9
-30.7

Graph shows rotational transition at bending residues and can be used
to identify hinge bending residues.
Probably only informative for interdomain rotations greater than 20 degrees
Residue
iResidue
i+1Distance of hinge axis to residue i in
(A) Distance of hinge axis to residue i in
(A) Change in
(deg) Change in
(deg) Angle of psi(i) axis to hinge axis
(deg) Angle of psi(i) axis to hinge axis
(deg) Percentage Progress
ALA-405
ALA-406
17.6
17.5
0.2
4.4
84.4
80.6
124.8
ALA-406
VAL-407
15.9
15.7
-7.6
10.9
133.6
137.9
261.2
VAL-407
GLU-408
18.3
18.2
-13.9
4.8
154.6
154.6
-326.4

Graph shows rotational transition at bending residues and can be used
to identify hinge bending residues.
Probably only informative for interdomain rotations greater than 20 degrees
Residue
iResidue
i+1Distance of hinge axis to residue i in
(A) Distance of hinge axis to residue i in
(A) Change in
(deg) Change in
(deg) Angle of psi(i) axis to hinge axis
(deg) Angle of psi(i) axis to hinge axis
(deg) Percentage Progress
LYS-441
VAL-442
15.8
15.6
11.9
-9.6
49.6
47.1
-5.3
VAL-442
ALA-443
17.0
16.8
5.9
-10.6
80.3
75.8
4.0
ALA-443
LEU-444
13.8
13.7
3.4
-2.4
54.7
59.0
-100.0

Graph shows rotational transition at bending residues and can be used
to identify hinge bending residues.
Probably only informative for interdomain rotations greater than 20 degrees
Residue
iResidue
i+1Distance of hinge axis to residue i in
(A) Distance of hinge axis to residue i in
(A) Change in
(deg) Change in
(deg) Angle of psi(i) axis to hinge axis
(deg) Angle of psi(i) axis to hinge axis
(deg) Percentage Progress
ALA-446
MET-447
13.9
13.6
11.2
-14.5
107.1
105.5
105.5
MET-447
GLU-448
10.2
9.8
-6.0
11.0
25.9
27.1
-12.5
GLU-448
ALA-449
10.2
9.7
-2.0
-2.6
43.9
48.6
124.3
ALA-449
PRO-450
12.5
12.1
4.6
-2.6
126.6
126.5
-118.5
PRO-450
LEU-451
10.5
10.2
8.8
-3.3
132.5
135.0
-76.3
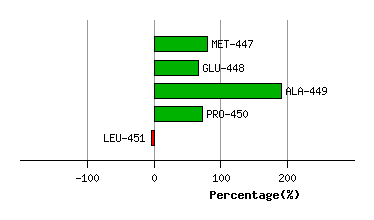
Graph shows rotational transition at bending residues and can be used
to identify hinge bending residues.
Probably only informative for interdomain rotations greater than 20 degrees
Residue
iResidue
i+1Distance of hinge axis to residue i in
(A) Distance of hinge axis to residue i in
(A) Change in
(deg) Change in
(deg) Angle of psi(i) axis to hinge axis
(deg) Angle of psi(i) axis to hinge axis
(deg) Percentage Progress
VAL-469
LYS-470
6.7
7.0
0.1
-1.5
16.3
23.1
-53.6
LYS-470
GLY-471
8.5
9.0
12.2
-8.9
82.6
84.3
165.5
GLY-471
GLY-472
11.1
11.5
-11.6
5.6
94.1
89.9
-70.9
GLY-472
ASP-473
9.3
9.9
22.1
-34.5
149.1
153.7
229.1
GLY-472
ASP-473
9.3
9.9
22.1
-34.5
149.1
153.7
229.1

Graph shows rotational transition at bending residues and can be used
to identify hinge bending residues.
Probably only informative for interdomain rotations greater than 20 degrees
Residue
iResidue
i+1Distance of hinge axis to residue i in
(A) Distance of hinge axis to residue i in
(A) Change in
(deg) Change in
(deg) Angle of psi(i) axis to hinge axis
(deg) Angle of psi(i) axis to hinge axis
(deg) Percentage Progress
GLY-472
ASP-473
9.3
9.9
22.1
-34.5
149.1
153.7
229.1
GLY-472
ASP-473
9.3
9.9
22.1
-34.5
149.1
153.7
229.1
ASP-473
GLY-474
8.6
8.2
32.3
0.3
86.6
85.2
-33.2
GLY-474
ASN-475
6.6
6.9
6.0
-8.5
43.5
48.2
107.2

Graph shows rotational transition at bending residues and can be used
to identify hinge bending residues.
Probably only informative for interdomain rotations greater than 20 degrees
Residue
iResidue
i+1Distance of hinge axis to residue i in
(A) Distance of hinge axis to residue i in
(A) Change in
(deg) Change in
(deg) Angle of psi(i) axis to hinge axis
(deg) Angle of psi(i) axis to hinge axis
(deg) Percentage Progress
TYR-478
ASN-479
1.9
1.8
-6.3
4.4
71.1
71.2
63.1
ASN-479
ALA-480
1.3
1.4
5.7
-12.1
135.4
132.2
64.6
ALA-480
ALA-481
3.2
3.5
6.7
-9.3
140.3
143.2
107.5
ALA-481
THR-482
4.7
4.8
8.5
-3.4
134.5
133.9
-106.3

Graph shows rotational transition at bending residues and can be used
to identify hinge bending residues.
Probably only informative for interdomain rotations greater than 20 degrees
Residue
iResidue
i+1Distance of hinge axis to residue i in
(A) Distance of hinge axis to residue i in
(A) Change in
(deg) Change in
(deg) Angle of psi(i) axis to hinge axis
(deg) Angle of psi(i) axis to hinge axis
(deg) Percentage Progress
GLU-483
GLU-484
1.2
1.5
-7.6
6.3
84.3
81.1
25.4
GLU-484
TYR-485
3.8
3.4
-6.2
10.3
5.1
3.5
-6.9
TYR-485
GLY-486
5.2
5.0
-3.6
-1.2
79.3
82.3
296.2

Graph shows rotational transition at bending residues and can be used
to identify hinge bending residues.
Probably only informative for interdomain rotations greater than 20 degrees
Residue
iResidue
i+1Distance of hinge axis to residue i in
(A) Distance of hinge axis to residue i in
(A) Change in
(deg) Change in
(deg) Angle of psi(i) axis to hinge axis
(deg) Angle of psi(i) axis to hinge axis
(deg) Percentage Progress
ASP-490
MET-491
11.0
10.8
8.8
-11.7
146.2
144.0
135.5
MET-491
GLY-492
8.8
8.7
-0.8
6.8
92.4
98.4
51.3
GLY-492
ILE-493
10.3
10.3
-2.8
1.3
92.3
100.3
72.9
ILE-493
LEU-494
7.6
7.6
-14.8
30.7
166.7
173.9
476.0

Graph shows rotational transition at bending residues and can be used
to identify hinge bending residues.
Probably only informative for interdomain rotations greater than 20 degrees
Residue
iResidue
i+1Distance of hinge axis to residue i in
(A) Distance of hinge axis to residue i in
(A) Change in
(deg) Change in
(deg) Angle of psi(i) axis to hinge axis
(deg) Angle of psi(i) axis to hinge axis
(deg) Percentage Progress
TYR-506
ALA-507
17.5
17.5
12.9
-6.7
68.0
66.4
-28.0
ALA-507
ALA-508
17.2
17.0
-5.4
-0.7
40.1
39.0
-61.2
ALA-508
SER-509
16.5
16.4
-7.3
2.5
50.4
50.8
225.1

Graph shows rotational transition at bending residues and can be used
to identify hinge bending residues.
Probably only informative for interdomain rotations greater than 20 degrees
Residue
iResidue
i+1Distance of hinge axis to residue i in
(A) Distance of hinge axis to residue i in
(A) Change in
(deg) Change in
(deg) Angle of psi(i) axis to hinge axis
(deg) Angle of psi(i) axis to hinge axis
(deg) Percentage Progress
VAL-510
ALA-511
22.1
21.8
11.1
-12.0
92.6
97.0
216.1
ALA-511
GLY-512
21.0
21.0
-6.4
11.6
153.1
150.8
-5.1
GLY-512
LEU-513
21.0
21.0
5.8
2.7
73.9
72.2
112.9

Graph shows rotational transition at bending residues and can be used
to identify hinge bending residues.
Probably only informative for interdomain rotations greater than 20 degrees