Hcv Ns3 Protease/helicase
(All numbering and residues are taken from first PDB file)
![]()
![]()
Bending Residue Dihedral Analysis
Residue
iResidue
i+1Distance of hinge axis to residue i in
(A) Distance of hinge axis to residue i in
(A) Change in
(deg) Change in
(deg) Angle of psi(i) axis to hinge axis
(deg) Angle of psi(i) axis to hinge axis
(deg) Percentage Progress
VAL-329
THR-330
8.2
8.2
11.2
3.8
112.8
111.5
-128.6
THR-330
VAL-331
9.2
9.2
-23.8
14.5
4.0
7.5
199.9
VAL-331
PRO-332
10.4
10.8
-10.1
10.9
75.5
79.4
-11.8

Graph shows rotational transition at bending residues and can be used
to identify hinge bending residues.
Probably only informative for interdomain rotations greater than 20 degrees
Residue
iResidue
i+1Distance of hinge axis to residue i in
(A) Distance of hinge axis to residue i in
(A) Change in
(deg) Change in
(deg) Angle of psi(i) axis to hinge axis
(deg) Angle of psi(i) axis to hinge axis
(deg) Percentage Progress
ALA-390
TYR-391
25.0
25.1
-19.8
13.6
63.5
52.2
50.3
TYR-391
TYR-392
23.1
23.3
10.0
-0.1
104.3
104.4
106.8
TYR-392
ARG-393
19.9
20.2
6.3
-24.7
150.0
145.6
305.5

Graph shows rotational transition at bending residues and can be used
to identify hinge bending residues.
Probably only informative for interdomain rotations greater than 20 degrees
Residue
iResidue
i+1Distance of hinge axis to residue i in
(A) Distance of hinge axis to residue i in
(A) Change in
(deg) Change in
(deg) Angle of psi(i) axis to hinge axis
(deg) Angle of psi(i) axis to hinge axis
(deg) Percentage Progress
GLY-394
LEU-395
21.0
21.5
-23.4
13.3
77.8
77.4
83.9
LEU-395
ASP-396
24.2
24.7
-3.5
4.4
78.8
79.3
11.0
ASP-396
VAL-397
26.8
27.1
16.0
-10.5
170.8
170.0
-78.9

Graph shows rotational transition at bending residues and can be used
to identify hinge bending residues.
Probably only informative for interdomain rotations greater than 20 degrees
Residue
iResidue
i+1Distance of hinge axis to residue i in
(A) Distance of hinge axis to residue i in
(A) Change in
(deg) Change in
(deg) Angle of psi(i) axis to hinge axis
(deg) Angle of psi(i) axis to hinge axis
(deg) Percentage Progress
ASN-429
THR-430
10.6
10.8
-5.1
-1.2
41.7
42.7
48.1
THR-430
CYS-431
9.8
9.9
3.7
-13.0
142.1
143.0
258.0
CYS-431
VAL-432
8.8
9.4
30.2
-20.2
143.4
141.0
-248.0
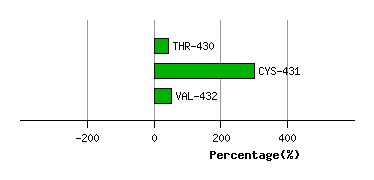
Graph shows rotational transition at bending residues and can be used
to identify hinge bending residues.
Probably only informative for interdomain rotations greater than 20 degrees
Residue
iResidue
i+1Distance of hinge axis to residue i in
(A) Distance of hinge axis to residue i in
(A) Change in
(deg) Change in
(deg) Angle of psi(i) axis to hinge axis
(deg) Angle of psi(i) axis to hinge axis
(deg) Percentage Progress
ILE-446
GLU-447
3.7
3.5
5.4
-13.8
118.1
116.1
81.5
GLU-447
THR-448
6.1
5.8
4.3
2.7
126.8
129.5
-93.8
THR-448
THR-449
7.1
7.0
7.6
-5.8
140.3
138.7
28.0

Graph shows rotational transition at bending residues and can be used
to identify hinge bending residues.
Probably only informative for interdomain rotations greater than 20 degrees
Residue
iResidue
i+1Distance of hinge axis to residue i in
(A) Distance of hinge axis to residue i in
(A) Change in
(deg) Change in
(deg) Angle of psi(i) axis to hinge axis
(deg) Angle of psi(i) axis to hinge axis
(deg) Percentage Progress
GLY-479
GLU-480
4.5
4.7
-2.2
-14.1
36.7
42.1
187.5
GLU-480
ARG-481
3.4
3.4
3.8
-8.9
112.9
109.1
-11.7
ARG-481
PRO-482
0.8
0.8
4.8
9.1
89.8
88.0
35.8

Graph shows rotational transition at bending residues and can be used
to identify hinge bending residues.
Probably only informative for interdomain rotations greater than 20 degrees