Ribonuclease Inhibitor
(All numbering and residues are taken from first PDB file)
![]()
![]()
Bending Residue Dihedral Analysis
Residue
iResidue
i+1Distance of hinge axis to residue i in
(A) Distance of hinge axis to residue i in
(A) Change in
(deg) Change in
(deg) Angle of psi(i) axis to hinge axis
(deg) Angle of psi(i) axis to hinge axis
(deg) Percentage Progress
VAL-160
LEU-161
18.5
18.4
-13.1
15.2
11.9
10.1
-13.2
LEU-161
ARG-162
17.0
16.5
3.1
-10.7
129.6
135.1
12.0
ARG-162
ALA-163
19.5
19.0
-19.2
25.0
88.2
88.5
82.9
ALA-163
THR-164
22.2
21.9
-31.8
30.2
70.9
72.2
71.1
THR-164
ARG-165
20.9
21.4
4.5
15.1
167.8
169.1
-278.2
ARG-165
ALA-166
20.8
21.6
-13.2
-7.8
89.5
85.5
61.0

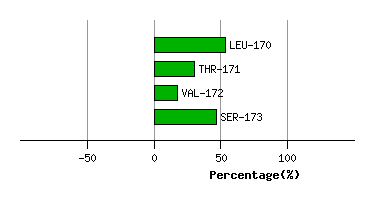
Graph shows rotational transition at bending residues and can be used
to identify hinge bending residues.
Probably only informative for interdomain rotations greater than 20 degrees
Residue
iResidue
i+1Distance of hinge axis to residue i in
(A) Distance of hinge axis to residue i in
(A) Change in
(deg) Change in
(deg) Angle of psi(i) axis to hinge axis
(deg) Angle of psi(i) axis to hinge axis
(deg) Percentage Progress
GLU-169
LEU-170
13.5
13.6
-0.2
5.3
145.4
145.0
89.3
LEU-170
THR-171
11.0
11.1
-9.2
9.8
102.8
103.1
-23.3
THR-171
VAL-172
8.7
8.9
11.7
-16.5
29.5
30.4
-12.7
VAL-172
SER-173
6.4
6.3
24.9
-21.6
107.8
99.9
-35.7
VAL-172
SER-173
6.4
6.3
24.9
-21.6
107.8
99.9
-35.7
Graph shows rotational transition at bending residues and can be used
to identify hinge bending residues.
Probably only informative for interdomain rotations greater than 20 degrees
Residue
iResidue
i+1Distance of hinge axis to residue i in
(A) Distance of hinge axis to residue i in
(A) Change in
(deg) Change in
(deg) Angle of psi(i) axis to hinge axis
(deg) Angle of psi(i) axis to hinge axis
(deg) Percentage Progress
VAL-172
SER-173
6.4
6.3
24.9
-21.6
107.8
99.9
-35.7
VAL-172
SER-173
6.4
6.3
24.9
-21.6
107.8
99.9
-35.7
SER-173
ASN-174
4.3
4.6
11.6
-11.1
163.6
165.1
9.5
ASN-174
ASN-175
3.1
3.6
-10.4
11.9
47.0
49.8
-29.7

Graph shows rotational transition at bending residues and can be used
to identify hinge bending residues.
Probably only informative for interdomain rotations greater than 20 degrees
Residue
iResidue
i+1Distance of hinge axis to residue i in
(A) Distance of hinge axis to residue i in
(A) Change in
(deg) Change in
(deg) Angle of psi(i) axis to hinge axis
(deg) Angle of psi(i) axis to hinge axis
(deg) Percentage Progress
ARG-183
VAL-184
11.5
10.9
9.3
-14.5
79.7
84.0
-16.5
VAL-184
LEU-185
13.5
12.7
-17.5
26.7
70.5
69.5
7.0
LEU-185
GLY-186
11.2
10.6
-8.2
-2.2
5.2
6.8
113.1

Graph shows rotational transition at bending residues and can be used
to identify hinge bending residues.
Probably only informative for interdomain rotations greater than 20 degrees
Residue
iResidue
i+1Distance of hinge axis to residue i in
(A) Distance of hinge axis to residue i in
(A) Change in
(deg) Change in
(deg) Angle of psi(i) axis to hinge axis
(deg) Angle of psi(i) axis to hinge axis
(deg) Percentage Progress
ALA-190
ASP-191
14.3
13.8
-3.8
-14.6
99.4
105.2
-40.9
ASP-191
SER-192
17.9
17.5
-1.0
28.0
75.4
65.6
-116.8
SER-192
ALA-193
17.5
17.5
29.1
-32.3
39.6
43.6
21.6
ALA-193
CYS-194
19.4
19.7
-3.6
-5.9
95.9
94.2
51.7
CYS-194
GLN-195
17.5
18.3
-13.9
29.2
129.5
126.7
190.9
GLN-195
LEU-196
15.5
16.3
-25.7
22.9
57.0
59.6
46.0

Graph shows rotational transition at bending residues and can be used
to identify hinge bending residues.
Probably only informative for interdomain rotations greater than 20 degrees
Residue
iResidue
i+1Distance of hinge axis to residue i in
(A) Distance of hinge axis to residue i in
(A) Change in
(deg) Change in
(deg) Angle of psi(i) axis to hinge axis
(deg) Angle of psi(i) axis to hinge axis
(deg) Percentage Progress
GLU-197
THR-198
12.7
12.5
-6.3
13.3
118.4
115.6
100.7
THR-198
LEU-199
10.6
10.7
-8.9
3.3
129.9
132.5
-94.3
LEU-199
ARG-200
7.6
7.7
-9.6
10.8
113.6
111.4
43.3

Graph shows rotational transition at bending residues and can be used
to identify hinge bending residues.
Probably only informative for interdomain rotations greater than 20 degrees
Residue
iResidue
i+1Distance of hinge axis to residue i in
(A) Distance of hinge axis to residue i in
(A) Change in
(deg) Change in
(deg) Angle of psi(i) axis to hinge axis
(deg) Angle of psi(i) axis to hinge axis
(deg) Percentage Progress
GLY-205
LEU-206
5.4
5.3
6.4
3.4
39.9
40.1
107.7
LEU-206
THR-207
6.1
5.6
-6.1
-1.4
105.5
104.5
-45.7
THR-207
PRO-208
9.4
9.0
-3.3
0.1
167.4
166.0
-80.0

Graph shows rotational transition at bending residues and can be used
to identify hinge bending residues.
Probably only informative for interdomain rotations greater than 20 degrees
Residue
iResidue
i+1Distance of hinge axis to residue i in
(A) Distance of hinge axis to residue i in
(A) Change in
(deg) Change in
(deg) Angle of psi(i) axis to hinge axis
(deg) Angle of psi(i) axis to hinge axis
(deg) Percentage Progress
ASP-213
LEU-214
10.1
9.6
-13.3
8.5
71.0
68.0
11.9
LEU-214
CYS-215
6.6
6.1
7.1
-17.3
173.7
176.8
149.7
CYS-215
GLY-216
6.9
6.6
-13.9
9.2
65.9
65.1
35.4
GLY-216
ILE-217
9.4
9.3
1.0
-2.5
85.6
83.2
-29.6
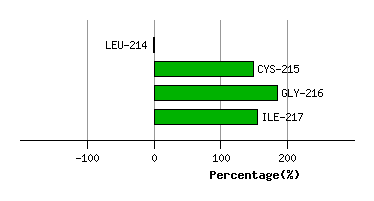
Graph shows rotational transition at bending residues and can be used
to identify hinge bending residues.
Probably only informative for interdomain rotations greater than 20 degrees
Residue
iResidue
i+1Distance of hinge axis to residue i in
(A) Distance of hinge axis to residue i in
(A) Change in
(deg) Change in
(deg) Angle of psi(i) axis to hinge axis
(deg) Angle of psi(i) axis to hinge axis
(deg) Percentage Progress
GLY-230
SER-231
6.2
6.4
16.9
-21.1
149.4
148.0
63.0
SER-231
ASN-232
7.3
7.6
6.3
1.4
97.7
97.5
-58.7
ASN-232
GLY-233
6.4
6.4
25.6
-22.1
59.3
63.4
18.0
GLY-233
LEU-234
9.8
9.6
-5.5
1.1
43.8
39.3
37.7
GLY-233
LEU-234
9.8
9.6
-5.5
1.1
43.8
39.3
37.7

Graph shows rotational transition at bending residues and can be used
to identify hinge bending residues.
Probably only informative for interdomain rotations greater than 20 degrees
Residue
iResidue
i+1Distance of hinge axis to residue i in
(A) Distance of hinge axis to residue i in
(A) Change in
(deg) Change in
(deg) Angle of psi(i) axis to hinge axis
(deg) Angle of psi(i) axis to hinge axis
(deg) Percentage Progress
GLY-233
LEU-234
9.8
9.6
-5.5
1.1
43.8
39.3
37.7
GLY-233
LEU-234
9.8
9.6
-5.5
1.1
43.8
39.3
37.7
LEU-234
GLY-235
9.0
8.9
-0.1
0.2
58.1
55.6
-58.3
GLY-235
ASP-236
11.9
12.0
-6.6
-3.9
11.4
10.7
117.6

Graph shows rotational transition at bending residues and can be used
to identify hinge bending residues.
Probably only informative for interdomain rotations greater than 20 degrees