Thermolysin (E.C.3.4.24.27)
(All numbering and residues are taken from first PDB file)
![]()
![]()
Bending Residue Dihedral Analysis
Residue
iResidue
i+1Distance of hinge axis to residue i in
(A) Distance of hinge axis to residue i in
(A) Change in
(deg) Change in
(deg) Angle of psi(i) axis to hinge axis
(deg) Angle of psi(i) axis to hinge axis
(deg) Percentage Progress
GLY-3
THR-4
17.7
17.1
10.9
-7.3
88.7
93.3
-56.3
THR-4
SER-5
16.6
16.1
9.4
3.1
38.1
33.1
354.5
SER-5
THR-6
13.5
13.3
-8.5
22.0
125.1
132.3
-23.1
THR-6
VAL-7
14.7
14.7
-14.9
3.0
31.3
40.1
244.1
THR-6
VAL-7
14.7
14.7
-14.9
3.0
31.3
40.1
244.1

Graph shows rotational transition at bending residues and can be used
to identify hinge bending residues.
Probably only informative for interdomain rotations greater than 20 degrees
Residue
iResidue
i+1Distance of hinge axis to residue i in
(A) Distance of hinge axis to residue i in
(A) Change in
(deg) Change in
(deg) Angle of psi(i) axis to hinge axis
(deg) Angle of psi(i) axis to hinge axis
(deg) Percentage Progress
THR-6
VAL-7
14.7
14.7
-14.9
3.0
31.3
40.1
244.1
THR-6
VAL-7
14.7
14.7
-14.9
3.0
31.3
40.1
244.1
VAL-7
GLY-8
13.6
13.6
-16.9
8.0
35.1
36.1
113.5
GLY-8
VAL-9
14.7
14.8
20.1
-14.9
143.8
145.5
-138.6

Graph shows rotational transition at bending residues and can be used
to identify hinge bending residues.
Probably only informative for interdomain rotations greater than 20 degrees
Residue
iResidue
i+1Distance of hinge axis to residue i in
(A) Distance of hinge axis to residue i in
(A) Change in
(deg) Change in
(deg) Angle of psi(i) axis to hinge axis
(deg) Angle of psi(i) axis to hinge axis
(deg) Percentage Progress
LEU-30
GLN-31
14.0
14.0
7.8
-7.4
139.7
139.2
-98.7
GLN-31
ASP-32
12.5
12.4
8.7
-3.0
105.0
102.4
-24.1
ASP-32
ASN-33
9.0
8.9
-6.5
-2.0
24.1
24.5
224.2
ASN-33
THR-34
8.3
8.1
2.5
16.0
75.2
80.0
34.4
ASN-33
THR-34
8.3
8.1
2.5
16.0
75.2
80.0
34.4

Graph shows rotational transition at bending residues and can be used
to identify hinge bending residues.
Probably only informative for interdomain rotations greater than 20 degrees
Residue
iResidue
i+1Distance of hinge axis to residue i in
(A) Distance of hinge axis to residue i in
(A) Change in
(deg) Change in
(deg) Angle of psi(i) axis to hinge axis
(deg) Angle of psi(i) axis to hinge axis
(deg) Percentage Progress
ASN-33
THR-34
8.3
8.1
2.5
16.0
75.2
80.0
34.4
ASN-33
THR-34
8.3
8.1
2.5
16.0
75.2
80.0
34.4
THR-34
ARG-35
5.3
5.6
-21.0
30.9
86.9
99.7
-152.7
ARG-35
GLY-36
3.2
2.2
66.0
-122.7
61.4
37.1
-783.4
GLY-36
ASP-37
4.8
2.8
108.6
-27.6
65.1
94.2
227.7
ASP-37
GLY-38
8.1
6.1
125.3
165.8
139.6
116.4
841.8
GLY-38
ILE-39
8.5
8.3
-14.4
7.8
30.0
23.9
-75.4
ILE-39
PHE-40
9.1
9.0
8.9
-6.2
109.4
102.1
332.3
PHE-40
THR-41
12.7
12.6
14.7
-6.2
159.9
162.2
-298.0

Graph shows rotational transition at bending residues and can be used
to identify hinge bending residues.
Probably only informative for interdomain rotations greater than 20 degrees
Residue
iResidue
i+1Distance of hinge axis to residue i in
(A) Distance of hinge axis to residue i in
(A) Change in
(deg) Change in
(deg) Angle of psi(i) axis to hinge axis
(deg) Angle of psi(i) axis to hinge axis
(deg) Percentage Progress
ALA-77
GLY-78
6.0
6.0
-6.1
-6.5
43.0
45.1
25.0
GLY-78
VAL-79
3.0
3.2
19.9
-12.3
79.6
72.6
-2.5
VAL-79
THR-80
1.6
1.5
10.5
-8.5
104.5
100.6
101.9

Graph shows rotational transition at bending residues and can be used
to identify hinge bending residues.
Probably only informative for interdomain rotations greater than 20 degrees
Residue
iResidue
i+1Distance of hinge axis to residue i in
(A) Distance of hinge axis to residue i in
(A) Change in
(deg) Change in
(deg) Angle of psi(i) axis to hinge axis
(deg) Angle of psi(i) axis to hinge axis
(deg) Percentage Progress
ASN-96
ASN-97
10.5
10.7
0.1
10.1
103.9
104.2
36.8
ASN-97
ALA-98
8.1
8.4
-2.8
-16.6
80.9
73.0
173.5
ALA-98
ALA-99
11.2
11.4
3.1
-8.9
133.0
133.0
155.2
ALA-99
ILE-100
11.1
10.9
11.6
-2.0
155.2
159.6
-185.8

Graph shows rotational transition at bending residues and can be used
to identify hinge bending residues.
Probably only informative for interdomain rotations greater than 20 degrees
Residue
iResidue
i+1Distance of hinge axis to residue i in
(A) Distance of hinge axis to residue i in
(A) Change in
(deg) Change in
(deg) Angle of psi(i) axis to hinge axis
(deg) Angle of psi(i) axis to hinge axis
(deg) Percentage Progress
ASN-111
ASN-112
18.6
18.8
3.2
7.8
131.8
135.4
-146.8
ASN-112
ALA-113
18.2
18.4
-10.5
-14.5
31.1
39.6
537.0
ALA-113
PHE-114
16.8
16.4
-26.3
9.0
55.4
59.5
28.2

Graph shows rotational transition at bending residues and can be used
to identify hinge bending residues.
Probably only informative for interdomain rotations greater than 20 degrees
Residue
iResidue
i+1Distance of hinge axis to residue i in
(A) Distance of hinge axis to residue i in
(A) Change in
(deg) Change in
(deg) Angle of psi(i) axis to hinge axis
(deg) Angle of psi(i) axis to hinge axis
(deg) Percentage Progress
GLU-119
MET-120
17.2
16.7
17.3
0.9
158.5
165.2
-575.0
MET-120
VAL-121
15.6
15.1
-15.0
21.2
57.6
61.4
-73.1
VAL-121
TYR-122
17.3
17.3
-5.9
0.0
18.3
23.7
42.5

Graph shows rotational transition at bending residues and can be used
to identify hinge bending residues.
Probably only informative for interdomain rotations greater than 20 degrees
Residue
iResidue
i+1Distance of hinge axis to residue i in
(A) Distance of hinge axis to residue i in
(A) Change in
(deg) Change in
(deg) Angle of psi(i) axis to hinge axis
(deg) Angle of psi(i) axis to hinge axis
(deg) Percentage Progress
GLY-135
GLY-136
7.2
7.0
10.1
-9.6
84.1
82.9
141.5
GLY-136
ILE-137
6.4
6.4
-3.6
0.8
24.4
28.5
90.6
ILE-137
ASP-138
5.2
5.4
-8.6
4.0
80.4
82.5
82.4

Graph shows rotational transition at bending residues and can be used
to identify hinge bending residues.
Probably only informative for interdomain rotations greater than 20 degrees
Residue
iResidue
i+1Distance of hinge axis to residue i in
(A) Distance of hinge axis to residue i in
(A) Change in
(deg) Change in
(deg) Angle of psi(i) axis to hinge axis
(deg) Angle of psi(i) axis to hinge axis
(deg) Percentage Progress
VAL-192
TYR-193
8.5
8.6
-0.8
9.1
44.6
42.7
-96.5
TYR-193
THR-194
10.8
10.7
-4.5
-3.4
19.0
23.3
172.8
THR-194
PRO-195
11.1
11.0
-2.8
8.5
73.1
79.0
-106.2
PRO-195
GLY-196
8.7
8.6
-0.7
-21.5
13.8
29.3
323.4
GLY-196
ILE-197
9.0
8.0
10.4
14.8
108.3
113.4
-178.4
ILE-197
SER-198
8.2
7.6
-9.6
-2.6
126.4
129.6
-144.8
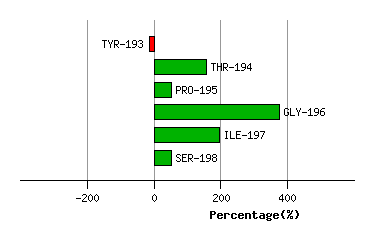
Graph shows rotational transition at bending residues and can be used
to identify hinge bending residues.
Probably only informative for interdomain rotations greater than 20 degrees
Residue
iResidue
i+1Distance of hinge axis to residue i in
(A) Distance of hinge axis to residue i in
(A) Change in
(deg) Change in
(deg) Angle of psi(i) axis to hinge axis
(deg) Angle of psi(i) axis to hinge axis
(deg) Percentage Progress
GLY-199
ASP-200
7.7
7.9
-34.1
8.9
69.9
55.8
25.1
ASP-200
SER-201
10.5
10.5
-17.3
23.1
11.9
15.3
-30.0
SER-201
LEU-202
11.8
11.7
0.9
-4.0
100.6
94.9
122.6
LEU-202
ARG-203
14.9
14.9
4.5
-5.9
94.2
87.8
126.3

Graph shows rotational transition at bending residues and can be used
to identify hinge bending residues.
Probably only informative for interdomain rotations greater than 20 degrees