Ffh
(All numbering and residues are taken from first PDB file)
![]()
![]()
Bending Residue Dihedral Analysis
Residue
iResidue
i+1Distance of hinge axis to residue i in
(A) Distance of hinge axis to residue i in
(A) Change in
(deg) Change in
(deg) Angle of psi(i) axis to hinge axis
(deg) Angle of psi(i) axis to hinge axis
(deg) Percentage Progress
ALA-41
ASP-42
11.7
11.8
0.6
-1.9
124.8
125.3
30.4
ASP-42
VAL-43
11.4
11.5
8.4
-8.8
63.6
65.3
48.3
VAL-43
ASN-44
9.9
9.9
4.5
1.7
93.3
89.4
58.5

Graph shows rotational transition at bending residues and can be used
to identify hinge bending residues.
Probably only informative for interdomain rotations greater than 20 degrees
Residue
iResidue
i+1Distance of hinge axis to residue i in
(A) Distance of hinge axis to residue i in
(A) Change in
(deg) Change in
(deg) Angle of psi(i) axis to hinge axis
(deg) Angle of psi(i) axis to hinge axis
(deg) Percentage Progress
THR-48
ARG-49
12.1
11.8
7.5
-9.0
145.4
145.0
2.9
ARG-49
ASP-50
14.8
14.3
1.6
1.7
135.6
137.3
-42.9
ASP-50
PHE-51
12.5
12.0
-6.2
10.5
62.0
64.7
-12.1

Graph shows rotational transition at bending residues and can be used
to identify hinge bending residues.
Probably only informative for interdomain rotations greater than 20 degrees
Residue
iResidue
i+1Distance of hinge axis to residue i in
(A) Distance of hinge axis to residue i in
(A) Change in
(deg) Change in
(deg) Angle of psi(i) axis to hinge axis
(deg) Angle of psi(i) axis to hinge axis
(deg) Percentage Progress
GLY-88
GLU-89
5.6
5.9
-25.9
34.9
95.1
86.1
39.4
GLU-89
ALA-90
8.6
9.1
-11.9
-0.2
19.1
18.0
106.2
ALA-90
ARG-91
10.1
10.0
5.9
-4.0
107.1
110.2
20.4
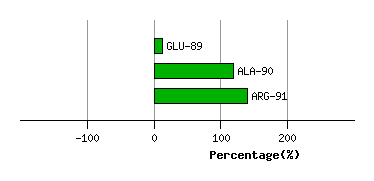
Graph shows rotational transition at bending residues and can be used
to identify hinge bending residues.
Probably only informative for interdomain rotations greater than 20 degrees
Residue
iResidue
i+1Distance of hinge axis to residue i in
(A) Distance of hinge axis to residue i in
(A) Change in
(deg) Change in
(deg) Angle of psi(i) axis to hinge axis
(deg) Angle of psi(i) axis to hinge axis
(deg) Percentage Progress
VAL-104
GLY-105
9.6
9.5
3.9
-6.3
101.4
103.4
-14.1
GLY-105
LEU-106
6.0
6.2
0.2
11.2
30.0
30.8
120.7
LEU-106
GLN-107
3.6
4.1
8.0
2.9
69.4
68.5
88.4
GLN-107
GLY-108
1.7
1.7
17.3
-29.2
63.7
59.6
-97.4
GLN-107
GLY-108
1.7
1.7
17.3
-29.2
63.7
59.6
-97.4

Graph shows rotational transition at bending residues and can be used
to identify hinge bending residues.
Probably only informative for interdomain rotations greater than 20 degrees
Residue
iResidue
i+1Distance of hinge axis to residue i in
(A) Distance of hinge axis to residue i in
(A) Change in
(deg) Change in
(deg) Angle of psi(i) axis to hinge axis
(deg) Angle of psi(i) axis to hinge axis
(deg) Percentage Progress
GLN-107
GLY-108
1.7
1.7
17.3
-29.2
63.7
59.6
-97.4
GLN-107
GLY-108
1.7
1.7
17.3
-29.2
63.7
59.6
-97.4
GLY-108
SER-109
2.6
2.5
8.1
5.1
9.5
4.6
148.6
SER-109
GLY-110
2.2
1.9
-3.8
25.9
102.8
110.8
124.7

Graph shows rotational transition at bending residues and can be used
to identify hinge bending residues.
Probably only informative for interdomain rotations greater than 20 degrees
Residue
iResidue
i+1Distance of hinge axis to residue i in
(A) Distance of hinge axis to residue i in
(A) Change in
(deg) Change in
(deg) Angle of psi(i) axis to hinge axis
(deg) Angle of psi(i) axis to hinge axis
(deg) Percentage Progress
GLY-190
ARG-191
5.7
6.5
16.6
15.0
48.0
55.6
244.6
ARG-191
LEU-192
4.5
4.9
12.4
2.4
120.3
130.3
-125.9
LEU-192
GLN-193
3.8
4.2
10.4
1.4
124.4
124.3
-96.8
GLN-193
ILE-194
7.3
7.7
0.1
21.5
90.2
88.1
-56.0
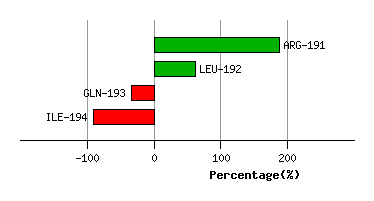
Graph shows rotational transition at bending residues and can be used
to identify hinge bending residues.
Probably only informative for interdomain rotations greater than 20 degrees
Residue
iResidue
i+1Distance of hinge axis to residue i in
(A) Distance of hinge axis to residue i in
(A) Change in
(deg) Change in
(deg) Angle of psi(i) axis to hinge axis
(deg) Angle of psi(i) axis to hinge axis
(deg) Percentage Progress
VAL-217
LEU-218
5.5
5.4
-4.2
5.2
98.7
92.9
12.7
LEU-218
ASP-219
1.8
1.8
-10.0
0.7
84.6
85.7
15.9
ASP-219
ALA-220
2.1
2.1
-10.5
4.0
38.1
43.5
66.2

Graph shows rotational transition at bending residues and can be used
to identify hinge bending residues.
Probably only informative for interdomain rotations greater than 20 degrees
Residue
iResidue
i+1Distance of hinge axis to residue i in
(A) Distance of hinge axis to residue i in
(A) Change in
(deg) Change in
(deg) Angle of psi(i) axis to hinge axis
(deg) Angle of psi(i) axis to hinge axis
(deg) Percentage Progress
MET-221
THR-222
6.7
6.9
-25.0
21.6
68.8
71.8
35.7
THR-222
GLY-223
6.5
6.8
10.3
11.1
42.3
41.4
212.6
GLY-223
GLN-224
7.2
7.6
-20.6
-14.8
91.6
102.0
-11.2
GLN-224
GLU-225
8.9
7.9
18.4
-9.7
149.1
144.0
-80.8
GLU-225
ALA-226
8.8
8.9
10.4
0.4
91.5
110.0
-33.1
ALA-226
LEU-227
5.4
5.3
5.5
1.8
65.7
72.6
57.0
LEU-227
SER-228
7.8
7.0
13.1
12.8
121.2
114.8
-203.1
SER-228
VAL-229
10.6
10.1
8.4
-17.2
130.3
121.5
-57.0
VAL-229
ALA-230
8.6
9.6
29.3
9.5
62.1
59.1
292.8
ALA-230
ARG-231
8.8
10.0
-8.3
7.8
95.7
90.3
9.6
ARG-231
ALA-232
12.4
13.7
-2.3
2.1
31.0
33.1
-15.6
ALA-232
PHE-233
13.2
14.3
6.0
-6.9
101.4
97.5
9.9
PHE-233
ASP-234
12.1
13.0
-3.8
1.6
126.0
126.4
-3.5

Graph shows rotational transition at bending residues and can be used
to identify hinge bending residues.
Probably only informative for interdomain rotations greater than 20 degrees
Residue
iResidue
i+1Distance of hinge axis to residue i in
(A) Distance of hinge axis to residue i in
(A) Change in
(deg) Change in
(deg) Angle of psi(i) axis to hinge axis
(deg) Angle of psi(i) axis to hinge axis
(deg) Percentage Progress
LEU-242
VAL-243
7.4
7.5
0.4
1.3
93.2
90.0
20.5
VAL-243
LEU-244
6.4
6.4
-3.3
3.6
104.0
99.7
28.8
LEU-244
THR-245
3.6
3.5
-8.1
2.3
109.5
111.3
11.3

Graph shows rotational transition at bending residues and can be used
to identify hinge bending residues.
Probably only informative for interdomain rotations greater than 20 degrees
Residue
iResidue
i+1Distance of hinge axis to residue i in
(A) Distance of hinge axis to residue i in
(A) Change in
(deg) Change in
(deg) Angle of psi(i) axis to hinge axis
(deg) Angle of psi(i) axis to hinge axis
(deg) Percentage Progress
SER-258
ALA-259
6.4
6.1
-4.0
4.2
71.0
68.1
-7.3
ALA-259
ARG-260
5.7
5.1
5.5
3.0
56.4
57.0
55.1
ARG-260
HIS-261
7.4
7.0
-2.7
-1.9
99.2
89.9
43.6
HIS-261
VAL-262
9.7
9.7
-1.9
9.4
38.5
29.8
-94.6
VAL-262
THR-263
10.9
10.5
-2.3
3.9
58.8
65.1
-1.0
THR-263
GLY-264
10.8
10.2
-4.9
-1.1
121.1
126.3
-61.8
GLY-264
LYS-265
11.6
11.3
-0.2
-5.9
70.5
78.5
23.1
LYS-265
PRO-266
10.3
10.3
10.5
0.2
66.2
65.7
78.9
PRO-266
ILE-267
8.9
9.0
4.0
-1.0
132.9
131.8
-40.0
ILE-267
TYR-268
6.7
6.8
6.1
-3.3
79.0
78.0
42.1

Graph shows rotational transition at bending residues and can be used
to identify hinge bending residues.
Probably only informative for interdomain rotations greater than 20 degrees
Residue
iResidue
i+1Distance of hinge axis to residue i in
(A) Distance of hinge axis to residue i in
(A) Change in
(deg) Change in
(deg) Angle of psi(i) axis to hinge axis
(deg) Angle of psi(i) axis to hinge axis
(deg) Percentage Progress
PHE-282
TYR-283
8.7
8.5
-9.0
-0.3
4.2
10.4
123.9
TYR-283
PRO-284
8.6
8.5
0.1
4.1
112.6
115.5
-6.9
PRO-284
GLU-285
5.1
5.0
-2.5
-4.1
40.6
39.0
27.6

Graph shows rotational transition at bending residues and can be used
to identify hinge bending residues.
Probably only informative for interdomain rotations greater than 20 degrees