Actin-Like Protein 3
(All numbering and residues are taken from first PDB file)
![]()
![]()
Bending Residue Dihedral Analysis
Residue
iResidue
i+1Distance of hinge axis to residue i in
(A) Distance of hinge axis to residue i in
(A) Change in
(deg) Change in
(deg) Angle of psi(i) axis to hinge axis
(deg) Angle of psi(i) axis to hinge axis
(deg) Percentage Progress
LEU-147
ALA-148
13.9
13.8
0.3
-0.7
66.0
64.1
6.1
ALA-148
LEU-149
13.3
13.1
-3.8
-1.9
91.7
90.7
11.0
LEU-149
ALA-150
9.7
9.5
20.3
-23.8
153.0
153.9
134.7
ALA-150
ALA-151
9.2
9.2
12.9
-14.0
78.3
75.9
175.8
ALA-150
ALA-151
9.2
9.2
12.9
-14.0
78.3
75.9
175.8

Graph shows rotational transition at bending residues and can be used
to identify hinge bending residues.
Probably only informative for interdomain rotations greater than 20 degrees
Residue
iResidue
i+1Distance of hinge axis to residue i in
(A) Distance of hinge axis to residue i in
(A) Change in
(deg) Change in
(deg) Angle of psi(i) axis to hinge axis
(deg) Angle of psi(i) axis to hinge axis
(deg) Percentage Progress
ALA-150
ALA-151
9.2
9.2
12.9
-14.0
78.3
75.9
175.8
ALA-150
ALA-151
9.2
9.2
12.9
-14.0
78.3
75.9
175.8
ALA-151
SER-152
11.3
11.4
3.5
0.5
109.9
112.9
20.7
SER-152
TRP-153
9.3
9.4
-3.0
-2.2
119.8
117.4
-135.7
TRP-153
THR-154
6.5
6.6
-3.0
7.6
122.0
121.8
99.6
THR-154
SER-155
9.5
9.6
-18.4
18.5
59.2
60.0
-54.6

Graph shows rotational transition at bending residues and can be used
to identify hinge bending residues.
Probably only informative for interdomain rotations greater than 20 degrees
Residue
iResidue
i+1Distance of hinge axis to residue i in
(A) Distance of hinge axis to residue i in
(A) Change in
(deg) Change in
(deg) Angle of psi(i) axis to hinge axis
(deg) Angle of psi(i) axis to hinge axis
(deg) Percentage Progress
LEU-163
THR-164
7.5
7.4
2.6
-3.6
18.2
19.2
3.2
THR-164
GLY-165
6.9
6.9
-0.4
2.6
118.8
119.0
107.4
GLY-165
THR-166
6.4
6.4
4.3
-4.5
55.5
55.1
64.9
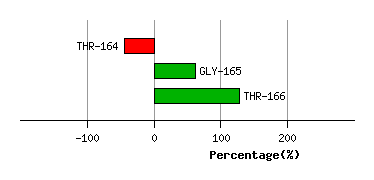
Graph shows rotational transition at bending residues and can be used
to identify hinge bending residues.
Probably only informative for interdomain rotations greater than 20 degrees
Residue
iResidue
i+1Distance of hinge axis to residue i in
(A) Distance of hinge axis to residue i in
(A) Change in
(deg) Change in
(deg) Angle of psi(i) axis to hinge axis
(deg) Angle of psi(i) axis to hinge axis
(deg) Percentage Progress
HIS-176
VAL-177
18.1
18.1
-3.9
1.0
91.9
91.1
59.3
VAL-177
ILE-178
14.5
14.5
2.7
-3.0
68.0
67.1
7.7
ILE-178
PRO-179
13.8
14.0
-1.1
0.3
105.2
105.3
-63.6
PRO-179
VAL-180
11.3
11.5
-0.2
-0.9
145.8
147.9
-27.7

Graph shows rotational transition at bending residues and can be used
to identify hinge bending residues.
Probably only informative for interdomain rotations greater than 20 degrees
Residue
iResidue
i+1Distance of hinge axis to residue i in
(A) Distance of hinge axis to residue i in
(A) Change in
(deg) Change in
(deg) Angle of psi(i) axis to hinge axis
(deg) Angle of psi(i) axis to hinge axis
(deg) Percentage Progress
ILE-186
GLY-187
15.7
15.9
11.7
-4.9
120.7
121.7
-168.0
GLY-187
SER-188
18.7
19.0
-9.2
10.8
8.6
2.9
-76.4
SER-188
CYS-189
19.1
19.2
-9.8
3.2
54.4
55.3
183.2
CYS-189
ILE-190
15.8
15.9
-3.0
3.4
83.1
80.9
-48.6
CYS-189
ILE-190
15.8
15.9
-3.0
3.4
83.1
80.9
-48.6

Graph shows rotational transition at bending residues and can be used
to identify hinge bending residues.
Probably only informative for interdomain rotations greater than 20 degrees
Residue
iResidue
i+1Distance of hinge axis to residue i in
(A) Distance of hinge axis to residue i in
(A) Change in
(deg) Change in
(deg) Angle of psi(i) axis to hinge axis
(deg) Angle of psi(i) axis to hinge axis
(deg) Percentage Progress
CYS-189
ILE-190
15.8
15.9
-3.0
3.4
83.1
80.9
-48.6
CYS-189
ILE-190
15.8
15.9
-3.0
3.4
83.1
80.9
-48.6
ILE-190
LYS-191
16.7
16.7
-3.3
3.6
146.8
148.6
14.0
LYS-191
HIS-192
17.4
17.3
-2.1
-2.3
70.7
70.9
87.8

Graph shows rotational transition at bending residues and can be used
to identify hinge bending residues.
Probably only informative for interdomain rotations greater than 20 degrees
Residue
iResidue
i+1Distance of hinge axis to residue i in
(A) Distance of hinge axis to residue i in
(A) Change in
(deg) Change in
(deg) Angle of psi(i) axis to hinge axis
(deg) Angle of psi(i) axis to hinge axis
(deg) Percentage Progress
VAL-303
ILE-304
11.1
11.1
-0.2
0.8
108.9
109.5
4.1
ILE-304
GLN-305
8.0
8.0
-1.4
3.6
50.7
51.5
25.4
GLN-305
ASN-306
8.1
8.1
-1.4
3.0
90.1
93.8
135.9
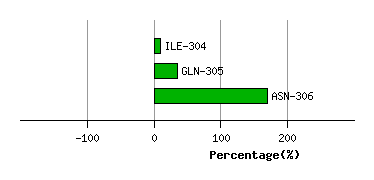
Graph shows rotational transition at bending residues and can be used
to identify hinge bending residues.
Probably only informative for interdomain rotations greater than 20 degrees
Residue
iResidue
i+1Distance of hinge axis to residue i in
(A) Distance of hinge axis to residue i in
(A) Change in
(deg) Change in
(deg) Angle of psi(i) axis to hinge axis
(deg) Angle of psi(i) axis to hinge axis
(deg) Percentage Progress
TYR-316
LYS-317
2.4
2.3
1.7
-2.1
132.2
131.9
181.1
LYS-317
ASN-318
1.8
1.9
-0.8
5.2
42.6
45.7
-141.9
ASN-318
ILE-319
3.8
3.8
-4.7
3.9
105.4
107.6
-64.9

Graph shows rotational transition at bending residues and can be used
to identify hinge bending residues.
Probably only informative for interdomain rotations greater than 20 degrees
Residue
iResidue
i+1Distance of hinge axis to residue i in
(A) Distance of hinge axis to residue i in
(A) Change in
(deg) Change in
(deg) Angle of psi(i) axis to hinge axis
(deg) Angle of psi(i) axis to hinge axis
(deg) Percentage Progress
SER-325
THR-326
22.5
22.6
-16.5
19.6
74.3
79.4
-22.3
THR-326
MET-327
19.2
19.3
-1.9
14.5
120.2
119.0
308.2
MET-327
PHE-328
21.1
21.4
-18.7
14.8
59.7
55.7
-34.6
PHE-328
ARG-329
22.7
22.5
-3.5
-2.4
91.4
95.1
-50.6
ARG-329
ASP-330
22.4
22.1
16.7
-20.2
145.2
139.1
18.0
ASP-330
PHE-331
19.5
19.3
-8.4
7.6
61.8
59.3
95.1
PHE-331
GLY-332
17.9
18.0
1.8
-0.7
94.3
91.6
-39.9
GLY-332
ARG-333
14.4
14.5
4.1
-9.0
56.4
60.1
-98.7
GLY-332
ARG-333
14.4
14.5
4.1
-9.0
56.4
60.1
-98.7

Graph shows rotational transition at bending residues and can be used
to identify hinge bending residues.
Probably only informative for interdomain rotations greater than 20 degrees
Residue
iResidue
i+1Distance of hinge axis to residue i in
(A) Distance of hinge axis to residue i in
(A) Change in
(deg) Change in
(deg) Angle of psi(i) axis to hinge axis
(deg) Angle of psi(i) axis to hinge axis
(deg) Percentage Progress
GLY-332
ARG-333
14.4
14.5
4.1
-9.0
56.4
60.1
-98.7
GLY-332
ARG-333
14.4
14.5
4.1
-9.0
56.4
60.1
-98.7
ARG-333
ARG-334
15.2
15.0
13.4
-9.8
15.5
10.4
161.6
ARG-334
LEU-335
15.8
15.7
10.7
-8.3
77.8
74.5
43.8

Graph shows rotational transition at bending residues and can be used
to identify hinge bending residues.
Probably only informative for interdomain rotations greater than 20 degrees
Residue
iResidue
i+1Distance of hinge axis to residue i in
(A) Distance of hinge axis to residue i in
(A) Change in
(deg) Change in
(deg) Angle of psi(i) axis to hinge axis
(deg) Angle of psi(i) axis to hinge axis
(deg) Percentage Progress
VAL-365
GLN-366
4.6
4.6
4.1
-2.5
47.0
46.1
64.0
GLN-366
VAL-367
6.4
6.5
8.6
-12.9
70.3
73.0
-73.8
VAL-367
ILE-368
8.9
9.0
-16.0
17.0
152.6
150.0
38.2
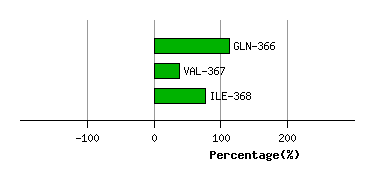
Graph shows rotational transition at bending residues and can be used
to identify hinge bending residues.
Probably only informative for interdomain rotations greater than 20 degrees
Residue
iResidue
i+1Distance of hinge axis to residue i in
(A) Distance of hinge axis to residue i in
(A) Change in
(deg) Change in
(deg) Angle of psi(i) axis to hinge axis
(deg) Angle of psi(i) axis to hinge axis
(deg) Percentage Progress
HIS-370
HIS-371
14.1
14.4
12.9
-11.9
108.5
103.4
-59.1
HIS-371
MET-372
17.1
17.5
-22.4
6.0
79.0
82.9
39.0
MET-372
GLN-373
16.6
17.7
57.9
-38.8
41.0
36.6
487.1
GLN-373
ARG-374
17.1
18.0
13.6
-21.2
86.6
81.0
14.7

Graph shows rotational transition at bending residues and can be used
to identify hinge bending residues.
Probably only informative for interdomain rotations greater than 20 degrees
Residue
iResidue
i+1Distance of hinge axis to residue i in
(A) Distance of hinge axis to residue i in
(A) Change in
(deg) Change in
(deg) Angle of psi(i) axis to hinge axis
(deg) Angle of psi(i) axis to hinge axis
(deg) Percentage Progress
PHE-379
GLY-380
16.4
16.4
1.3
-4.5
82.1
81.4
-56.9
GLY-380
GLY-381
13.8
13.7
4.7
-5.5
47.7
51.4
-55.0
GLY-381
SER-382
16.3
16.2
7.4
-5.2
19.5
18.8
104.1
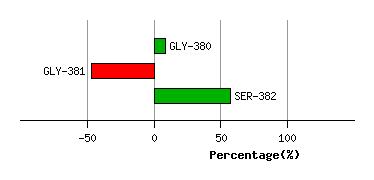
Graph shows rotational transition at bending residues and can be used
to identify hinge bending residues.
Probably only informative for interdomain rotations greater than 20 degrees