5'-Fluoro-5'-Deoxyadenosine Synthase
(All numbering and residues are taken from first PDB file)
![]()
![]()
Bending Residue Dihedral Analysis
Residue
iResidue
i+1Distance of hinge axis to residue i in
(A) Distance of hinge axis to residue i in
(A) Change in
(deg) Change in
(deg) Angle of psi(i) axis to hinge axis
(deg) Angle of psi(i) axis to hinge axis
(deg) Percentage Progress
GLN-93
ALA-94
21.3
21.1
1.0
11.1
127.8
122.3
-265.6
ALA-94
ALA-95
20.5
20.4
-126.5
126.1
41.6
34.2
210.2
ALA-95
LYS-96
19.9
20.4
-13.9
0.4
26.4
20.2
105.6

Graph shows rotational transition at bending residues and can be used
to identify hinge bending residues.
Probably only informative for interdomain rotations greater than 20 degrees
Residue
iResidue
i+1Distance of hinge axis to residue i in
(A) Distance of hinge axis to residue i in
(A) Change in
(deg) Change in
(deg) Angle of psi(i) axis to hinge axis
(deg) Angle of psi(i) axis to hinge axis
(deg) Percentage Progress
ALA-99
ARG-100
17.6
17.8
-30.3
58.3
83.8
78.8
88.8
ARG-100
GLY-101
21.1
21.5
-37.6
-7.6
37.9
15.2
420.2
GLY-101
GLN-102
22.4
21.7
-14.8
19.2
87.6
85.3
-69.6
GLN-102
TRP-103
24.1
23.6
-5.7
8.9
50.1
51.8
-31.8

Graph shows rotational transition at bending residues and can be used
to identify hinge bending residues.
Probably only informative for interdomain rotations greater than 20 degrees
Residue
iResidue
i+1Distance of hinge axis to residue i in
(A) Distance of hinge axis to residue i in
(A) Change in
(deg) Change in
(deg) Angle of psi(i) axis to hinge axis
(deg) Angle of psi(i) axis to hinge axis
(deg) Percentage Progress
VAL-188
ARG-189
5.2
5.3
4.0
-8.0
159.1
155.4
90.2
ARG-189
PHE-190
7.0
7.1
5.3
-7.6
120.3
121.2
-51.1
PHE-190
ASN-191
6.9
7.0
-0.1
-5.4
64.6
63.0
99.0

Graph shows rotational transition at bending residues and can be used
to identify hinge bending residues.
Probably only informative for interdomain rotations greater than 20 degrees
Residue
iResidue
i+1Distance of hinge axis to residue i in
(A) Distance of hinge axis to residue i in
(A) Change in
(deg) Change in
(deg) Angle of psi(i) axis to hinge axis
(deg) Angle of psi(i) axis to hinge axis
(deg) Percentage Progress
VAL-206
SER-207
7.2
6.9
-4.3
5.3
30.7
30.8
-40.4
SER-207
ALA-208
5.4
5.3
-5.0
-0.3
94.9
93.4
110.9
ALA-208
ILE-209
2.1
2.1
-8.1
7.9
167.8
167.2
-18.5

Graph shows rotational transition at bending residues and can be used
to identify hinge bending residues.
Probably only informative for interdomain rotations greater than 20 degrees
Residue
iResidue
i+1Distance of hinge axis to residue i in
(A) Distance of hinge axis to residue i in
(A) Change in
(deg) Change in
(deg) Angle of psi(i) axis to hinge axis
(deg) Angle of psi(i) axis to hinge axis
(deg) Percentage Progress
GLY-214
ASN-215
3.1
3.2
-9.5
2.3
78.7
83.8
26.2
ASN-215
VAL-216
3.8
3.8
1.2
-1.0
45.3
47.4
-32.3
VAL-216
TRP-217
4.0
3.9
0.2
-2.4
57.2
56.8
72.0

Graph shows rotational transition at bending residues and can be used
to identify hinge bending residues.
Probably only informative for interdomain rotations greater than 20 degrees
Residue
iResidue
i+1Distance of hinge axis to residue i in
(A) Distance of hinge axis to residue i in
(A) Change in
(deg) Change in
(deg) Angle of psi(i) axis to hinge axis
(deg) Angle of psi(i) axis to hinge axis
(deg) Percentage Progress
GLU-247
ALA-248
13.7
13.7
0.7
10.9
70.0
72.4
149.6
ALA-248
PRO-249
14.3
13.9
0.3
10.7
119.2
115.2
-103.7
PRO-249
LEU-250
17.1
16.9
3.8
0.1
135.3
143.6
61.8
LEU-250
THR-251
17.1
16.7
0.2
5.0
76.0
71.7
85.8
THR-251
PRO-252
17.0
16.7
-16.9
24.4
47.1
44.2
-87.9

Graph shows rotational transition at bending residues and can be used
to identify hinge bending residues.
Probably only informative for interdomain rotations greater than 20 degrees
Residue
iResidue
i+1Distance of hinge axis to residue i in
(A) Distance of hinge axis to residue i in
(A) Change in
(deg) Change in
(deg) Angle of psi(i) axis to hinge axis
(deg) Angle of psi(i) axis to hinge axis
(deg) Percentage Progress
ILE-263
ALA-264
7.8
7.5
-8.1
19.4
106.3
108.3
66.9
ALA-264
ILE-265
10.4
9.9
-11.1
12.4
153.8
147.3
-0.2
ILE-265
TYR-266
11.9
11.7
-2.6
-3.4
113.6
111.1
-38.9
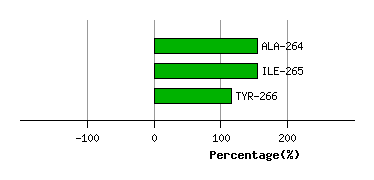
Graph shows rotational transition at bending residues and can be used
to identify hinge bending residues.
Probably only informative for interdomain rotations greater than 20 degrees
Residue
iResidue
i+1Distance of hinge axis to residue i in
(A) Distance of hinge axis to residue i in
(A) Change in
(deg) Change in
(deg) Angle of psi(i) axis to hinge axis
(deg) Angle of psi(i) axis to hinge axis
(deg) Percentage Progress
LEU-273
SER-274
12.6
12.5
4.6
-7.8
73.8
75.9
105.6
SER-274
ILE-275
9.6
9.4
-6.1
7.3
168.0
167.6
-4.7
ILE-275
ALA-276
7.9
7.8
-5.4
8.4
104.2
103.1
22.9
ALA-276
ARG-277
5.7
5.6
2.9
-5.2
3.1
1.4
-20.5

Graph shows rotational transition at bending residues and can be used
to identify hinge bending residues.
Probably only informative for interdomain rotations greater than 20 degrees
Residue
iResidue
i+1Distance of hinge axis to residue i in
(A) Distance of hinge axis to residue i in
(A) Change in
(deg) Change in
(deg) Angle of psi(i) axis to hinge axis
(deg) Angle of psi(i) axis to hinge axis
(deg) Percentage Progress
SER-281
LEU-282
3.3
3.4
-3.0
8.8
80.0
80.9
-24.8
LEU-282
ALA-283
0.7
0.6
-6.3
-2.4
122.6
121.6
-18.4
ALA-283
TYR-284
2.0
2.0
6.0
-3.3
106.0
102.0
-66.8
TYR-284
PRO-285
5.1
5.0
-4.6
8.9
42.9
45.5
1.1
PRO-285
TYR-286
5.9
6.1
-11.0
2.1
98.9
101.0
71.4
TYR-286
HIS-287
6.9
6.9
-2.2
3.3
156.4
162.2
-5.7
HIS-287
LEU-288
7.8
7.5
-10.0
15.9
128.0
122.0
57.1
LEU-288
LYS-289
6.0
5.8
7.1
-9.8
22.7
25.0
-45.4
LYS-289
GLU-290
6.0
5.6
8.5
-9.6
47.8
53.2
13.4
GLU-290
GLY-291
4.8
4.8
12.7
-4.5
72.5
71.8
58.9

Graph shows rotational transition at bending residues and can be used
to identify hinge bending residues.
Probably only informative for interdomain rotations greater than 20 degrees