Aspartate Aminotransferase
(All numbering and residues are taken from first PDB file)
![]()
![]()
Bending Residue Dihedral Analysis
Residue
iResidue
i+1Distance of hinge axis to residue i in
(A) Distance of hinge axis to residue i in
(A) Change in
(deg) Change in
(deg) Angle of psi(i) axis to hinge axis
(deg) Angle of psi(i) axis to hinge axis
(deg) Percentage Progress
GLY-38
VAL-39
8.6
9.5
-95.7
18.0
27.4
35.2
1012.7
VAL-39
TYR-40
8.6
9.0
28.8
-22.7
113.8
107.6
119.1
TYR-40
LYS-41
5.3
5.5
-11.9
19.3
48.6
43.0
13.1
LYS-41
ASP-42
4.8
5.2
7.2
5.1
114.0
110.0
-115.1
ASP-42
GLU-43
3.0
2.9
10.2
-9.7
91.2
91.0
73.6
GLU-43
THR-44
5.8
5.5
-9.9
19.4
71.8
65.4
-36.9
THR-44
GLY-45
7.6
7.3
7.5
-4.2
54.4
55.3
46.1
GLY-45
LYS-46
8.0
8.3
-17.9
2.4
66.2
69.4
-16.5

Graph shows rotational transition at bending residues and can be used
to identify hinge bending residues.
Probably only informative for interdomain rotations greater than 20 degrees
Residue
iResidue
i+1Distance of hinge axis to residue i in
(A) Distance of hinge axis to residue i in
(A) Change in
(deg) Change in
(deg) Angle of psi(i) axis to hinge axis
(deg) Angle of psi(i) axis to hinge axis
(deg) Percentage Progress
GLN-331
ARG-332
6.5
6.5
-12.1
11.9
98.8
103.9
-20.2
ARG-332
MET-333
8.0
8.1
7.5
-5.3
110.5
113.6
150.7
MET-333
ARG-334
6.7
6.6
-9.8
-4.1
7.7
6.9
230.3

Graph shows rotational transition at bending residues and can be used
to identify hinge bending residues.
Probably only informative for interdomain rotations greater than 20 degrees
Residue
iResidue
i+1Distance of hinge axis to residue i in
(A) Distance of hinge axis to residue i in
(A) Change in
(deg) Change in
(deg) Angle of psi(i) axis to hinge axis
(deg) Angle of psi(i) axis to hinge axis
(deg) Percentage Progress
LYS-355
GLN-356
7.5
8.0
19.4
-25.1
101.8
99.1
101.1
GLN-356
ASN-357
4.4
4.7
-17.7
25.5
28.7
21.3
-64.2
ASN-357
GLY-358
5.1
5.4
-6.1
-3.0
67.9
65.4
130.3

Graph shows rotational transition at bending residues and can be used
to identify hinge bending residues.
Probably only informative for interdomain rotations greater than 20 degrees
Residue
iResidue
i+1Distance of hinge axis to residue i in
(A) Distance of hinge axis to residue i in
(A) Change in
(deg) Change in
(deg) Angle of psi(i) axis to hinge axis
(deg) Angle of psi(i) axis to hinge axis
(deg) Percentage Progress
MET-359
PHE-360
2.9
2.3
6.0
-10.0
130.9
140.7
-5.2
PHE-360
SER-361
3.0
3.1
-34.1
3.8
51.8
38.5
537.0
SER-361
PHE-362
2.5
2.2
31.6
3.1
135.4
117.3
-282.7
PHE-362
SER-363
3.9
4.5
12.5
-4.3
97.5
86.9
-18.7
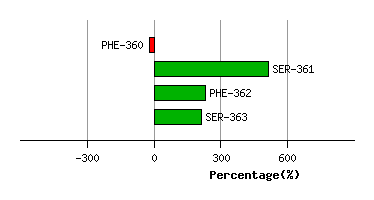
Graph shows rotational transition at bending residues and can be used
to identify hinge bending residues.
Probably only informative for interdomain rotations greater than 20 degrees