425Aa Long Hypothetical Proton Glutamate Symport Protein
(All numbering and residues are taken from first PDB file)
![]()
![]()
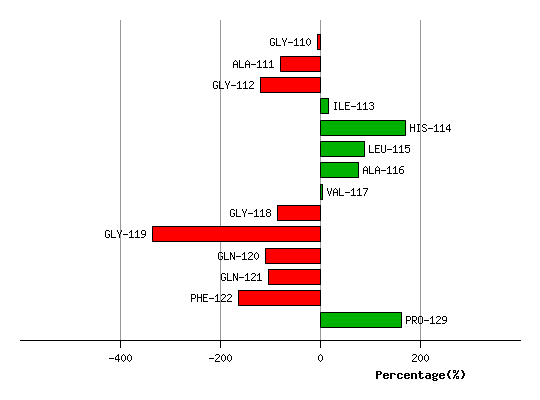
Bending Residue Dihedral Analysis
Residue
iResidue
i+1Distance of hinge axis to residue i in
(A) Distance of hinge axis to residue i in
(A) Change in
(deg) Change in
(deg) Angle of psi(i) axis to hinge axis
(deg) Angle of psi(i) axis to hinge axis
(deg) Percentage Progress
ALA-70
ALA-71
25.4
24.3
-97.4
33.2
137.3
150.0
-145.0
ALA-71
SER-72
25.7
25.7
18.4
-33.8
63.1
83.1
-4.2
SER-72
ILE-73
21.8
23.1
-136.4
-114.8
130.0
97.8
204.5
ILE-73
SER-74
19.8
20.2
-114.2
8.8
70.0
133.6
-71.8
SER-74
PRO-75
20.9
22.1
162.4
-26.2
89.9
39.4
248.1
PRO-75
ALA-76
18.2
19.5
173.7
-25.1
130.1
40.3
-286.0
ALA-76
ARG-77
15.3
19.7
-67.1
154.2
37.9
87.4
-105.4
ARG-77
LEU-78
16.1
21.5
105.8
-101.3
121.4
110.9
-14.6
LEU-78
GLY-79
18.4
18.9
-164.8
9.3
89.2
128.8
166.0
GLY-79
ARG-80
16.6
16.9
-128.3
-29.6
62.0
71.1
171.7
ARG-80
VAL-81
13.0
13.3
58.3
-21.2
166.8
125.4
-104.9
VAL-81
GLY-82
14.2
13.6
11.8
-29.9
125.2
157.3
41.9
GLY-82
VAL-83
16.1
14.8
3.4
26.2
106.1
100.9
-17.9

Graph shows rotational transition at bending residues and can be used
to identify hinge bending residues.
Probably only informative for interdomain rotations greater than 20 degrees
Residue
iResidue
i+1Distance of hinge axis to residue i in
(A) Distance of hinge axis to residue i in
(A) Change in
(deg) Change in
(deg) Angle of psi(i) axis to hinge axis
(deg) Angle of psi(i) axis to hinge axis
(deg) Percentage Progress
PRO-109
GLY-110
12.3
12.5
37.1
-40.9
76.6
77.9
-6.5
GLY-110
ALA-111
15.4
15.7
-137.0
65.9
120.0
120.5
-72.9
ALA-111
GLY-112
15.6
15.9
149.7
-171.2
49.0
18.4
-40.2
GLY-112
ILE-113
17.4
16.0
-171.4
-5.4
62.9
108.7
134.3
ILE-113
HIS-114
21.1
17.4
-132.4
28.0
89.5
91.9
155.6
HIS-114
LEU-115
22.1
20.8
30.1
-77.3
47.3
52.1
-83.0
LEU-115
ALA-116
23.3
23.8
-113.7
-57.8
89.8
75.5
-11.3
ALA-116
VAL-117
26.4
27.5
-138.0
167.9
32.7
98.6
-73.0
VAL-117
GLY-118
29.4
28.9
124.4
171.1
86.5
48.4
-89.1
GLY-118
GLY-119
32.0
32.4
-87.1
-63.5
73.6
123.9
-251.4
GLY-119
GLN-120
31.5
31.4
-65.2
-24.8
5.6
52.3
227.1
GLN-120
GLN-121
32.3
32.2
-11.8
13.0
38.7
49.6
5.3
GLN-121
PHE-122
32.2
29.8
5.3
20.1
128.4
162.9
-59.7
PRO-128
PRO-129
32.3
36.0
35.4
30.6
139.1
124.8
-70.6
Graph shows rotational transition at bending residues and can be used
to identify hinge bending residues.
Probably only informative for interdomain rotations greater than 20 degrees
Residue
iResidue
i+1Distance of hinge axis to residue i in
(A) Distance of hinge axis to residue i in
(A) Change in
(deg) Change in
(deg) Angle of psi(i) axis to hinge axis
(deg) Angle of psi(i) axis to hinge axis
(deg) Percentage Progress
GLN-220
GLY-221
20.9
20.3
15.3
120.5
101.4
121.5
309.3
GLY-221
VAL-222
18.3
18.5
-85.6
-33.3
21.3
122.0
-381.4
VAL-222
HIS-223
18.5
15.5
-57.2
102.2
83.6
133.4
17.1
HIS-223
VAL-224
17.6
14.0
-17.7
12.8
117.3
162.5
-0.2
VAL-224
VAL-225
14.4
15.8
-110.4
82.8
46.4
111.4
-4.6
VAL-225
GLY-226
12.4
13.9
173.5
-131.6
88.3
64.7
33.4
GLY-226
GLU-227
11.0
10.7
81.0
-0.8
24.2
22.8
183.7
GLU-227
LEU-228
12.2
12.5
-16.8
11.2
139.8
132.4
-10.9

Graph shows rotational transition at bending residues and can be used
to identify hinge bending residues.
Probably only informative for interdomain rotations greater than 20 degrees