Exodeoxyribonuclease V, Subunit Recd, Putative
(All numbering and residues are taken from first PDB file)
![]()
![]()
Bending Residue Dihedral Analysis
Residue
iResidue
i+1Distance of hinge axis to residue i in
(A) Distance of hinge axis to residue i in
(A) Change in
(deg) Change in
(deg) Angle of psi(i) axis to hinge axis
(deg) Angle of psi(i) axis to hinge axis
(deg) Percentage Progress
LEU-460
VAL-461
10.4
10.2
1.0
0.3
6.7
2.5
5.3
VAL-461
GLY-462
9.8
9.7
-1.2
23.5
109.4
108.1
60.0
GLY-462
ASP-463
6.6
6.5
10.3
1.9
55.8
33.0
37.4
ASP-463
THR-464
5.1
4.9
-5.1
-1.5
76.2
77.5
22.6
THR-464
ASP-465
4.7
4.8
-6.5
-4.9
138.8
130.7
-53.0

Graph shows rotational transition at bending residues and can be used
to identify hinge bending residues.
Probably only informative for interdomain rotations greater than 20 degrees
Residue
iResidue
i+1Distance of hinge axis to residue i in
(A) Distance of hinge axis to residue i in
(A) Change in
(deg) Change in
(deg) Angle of psi(i) axis to hinge axis
(deg) Angle of psi(i) axis to hinge axis
(deg) Percentage Progress
PRO-468
PRO-469
4.1
4.4
9.7
1.1
50.1
52.7
30.0
PRO-469
VAL-470
4.5
4.5
-11.1
10.6
95.9
97.0
-21.6
VAL-470
ASP-471
8.1
8.1
-8.0
8.2
146.1
153.3
10.0

Graph shows rotational transition at bending residues and can be used
to identify hinge bending residues.
Probably only informative for interdomain rotations greater than 20 degrees
Residue
iResidue
i+1Distance of hinge axis to residue i in
(A) Distance of hinge axis to residue i in
(A) Change in
(deg) Change in
(deg) Angle of psi(i) axis to hinge axis
(deg) Angle of psi(i) axis to hinge axis
(deg) Percentage Progress
GLN-490
VAL-491
14.3
15.1
2.4
-9.2
91.9
83.5
-44.5
VAL-491
TYR-492
11.4
12.8
13.9
54.5
64.0
57.0
195.8
TYR-492
ARG-493
13.2
15.0
146.0
10.9
78.7
11.6
688.1
ARG-493
GLN-494
10.9
15.4
20.5
40.8
15.3
63.2
-1453.0
GLN-494
ALA-495
9.4
14.8
159.0
-18.9
55.5
101.3
845.3
ALA-495
ALA-496
11.3
11.6
-149.9
-18.3
101.3
100.7
-252.9
ALA-496
LYS-497
11.2
10.8
-155.9
-145.3
136.8
141.6
246.8
LYS-497
ASN-498
8.3
9.3
-61.2
26.9
103.3
78.7
-131.2
ASN-498
PRO-499
6.1
7.2
-17.1
-9.4
78.6
91.8
-20.3
PRO-499
ILE-500
2.3
3.5
3.6
-19.8
164.2
148.1
105.8
ILE-500
ILE-501
2.3
3.1
-0.9
5.1
57.2
53.0
-31.0

Graph shows rotational transition at bending residues and can be used
to identify hinge bending residues.
Probably only informative for interdomain rotations greater than 20 degrees
Residue
iResidue
i+1Distance of hinge axis to residue i in
(A) Distance of hinge axis to residue i in
(A) Change in
(deg) Change in
(deg) Angle of psi(i) axis to hinge axis
(deg) Angle of psi(i) axis to hinge axis
(deg) Percentage Progress
ALA-698
ARG-699
14.1
13.7
-6.9
-4.3
170.2
172.6
-19.5
ARG-699
GLN-700
14.0
13.9
15.1
37.7
54.3
47.9
179.6
GLN-700
ARG-701
12.2
12.3
43.8
-14.4
24.2
51.4
161.7
ARG-701
GLU-702
12.4
11.1
11.8
12.6
61.1
47.0
97.5
GLU-702
ALA-703
14.4
13.7
-13.3
-7.4
129.4
134.6
-95.0
ALA-703
ARG-704
13.2
14.3
-2.4
-25.5
158.0
152.3
-168.7
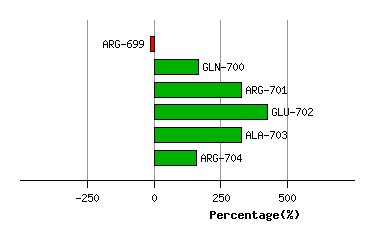
Graph shows rotational transition at bending residues and can be used
to identify hinge bending residues.
Probably only informative for interdomain rotations greater than 20 degrees