Helicase Pcra
(All numbering and residues are taken from first PDB file)
![]()
![]()
Bending Residue Dihedral Analysis
Residue
iResidue
i+1Distance of hinge axis to residue i in
(A) Distance of hinge axis to residue i in
(A) Change in
(deg) Change in
(deg) Angle of psi(i) axis to hinge axis
(deg) Angle of psi(i) axis to hinge axis
(deg) Percentage Progress
GLN-226
ASP-227
3.2
3.3
3.1
-10.7
52.8
50.7
-98.3
ASP-227
THR-228
1.5
1.5
28.9
-9.8
21.2
9.3
224.6
THR-228
ASN-229
3.2
2.7
13.1
18.6
66.5
53.5
173.6
ASN-229
ARG-230
2.6
1.8
-26.0
-7.5
57.3
75.3
276.1
ASN-229
ARG-230
2.6
1.8
-26.0
-7.5
57.3
75.3
276.1

Graph shows rotational transition at bending residues and can be used
to identify hinge bending residues.
Probably only informative for interdomain rotations greater than 20 degrees
Residue
iResidue
i+1Distance of hinge axis to residue i in
(A) Distance of hinge axis to residue i in
(A) Change in
(deg) Change in
(deg) Angle of psi(i) axis to hinge axis
(deg) Angle of psi(i) axis to hinge axis
(deg) Percentage Progress
ASN-229
ARG-230
2.6
1.8
-26.0
-7.5
57.3
75.3
276.1
ASN-229
ARG-230
2.6
1.8
-26.0
-7.5
57.3
75.3
276.1
ARG-230
ALA-231
5.5
4.9
7.9
-5.8
129.0
130.5
6.3
ALA-231
GLN-232
4.3
4.1
-1.2
18.2
118.1
112.8
29.3

Graph shows rotational transition at bending residues and can be used
to identify hinge bending residues.
Probably only informative for interdomain rotations greater than 20 degrees
Residue
iResidue
i+1Distance of hinge axis to residue i in
(A) Distance of hinge axis to residue i in
(A) Change in
(deg) Change in
(deg) Angle of psi(i) axis to hinge axis
(deg) Angle of psi(i) axis to hinge axis
(deg) Percentage Progress
ASP-251
ALA-252
4.3
4.7
-15.1
40.0
111.4
107.0
-141.4
ALA-252
ASP-253
3.4
4.3
-14.9
-13.1
70.6
72.4
74.6
ASP-253
GLN-254
1.7
2.2
-9.3
5.2
110.5
107.4
23.4

Graph shows rotational transition at bending residues and can be used
to identify hinge bending residues.
Probably only informative for interdomain rotations greater than 20 degrees
Residue
iResidue
i+1Distance of hinge axis to residue i in
(A) Distance of hinge axis to residue i in
(A) Change in
(deg) Change in
(deg) Angle of psi(i) axis to hinge axis
(deg) Angle of psi(i) axis to hinge axis
(deg) Percentage Progress
GLY-261
ALA-262
4.3
4.5
40.9
-22.3
48.5
59.4
90.5
ALA-262
ASP-263
2.5
2.5
-6.9
37.2
105.0
103.1
16.2
ASP-263
ILE-264
5.0
5.4
16.0
28.4
30.9
15.5
312.9

Graph shows rotational transition at bending residues and can be used
to identify hinge bending residues.
Probably only informative for interdomain rotations greater than 20 degrees
Residue
iResidue
i+1Distance of hinge axis to residue i in
(A) Distance of hinge axis to residue i in
(A) Change in
(deg) Change in
(deg) Angle of psi(i) axis to hinge axis
(deg) Angle of psi(i) axis to hinge axis
(deg) Percentage Progress
GLU-283
GLN-284
8.6
10.2
-0.2
-14.6
49.4
42.2
97.6
GLN-284
ASN-285
10.4
11.1
-7.4
18.9
116.8
119.2
37.8
ASN-285
TYR-286
9.7
9.9
-4.6
12.4
65.1
64.3
-31.1
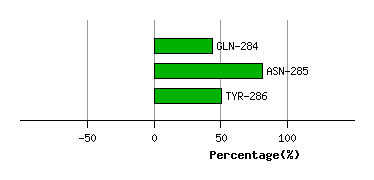
Graph shows rotational transition at bending residues and can be used
to identify hinge bending residues.
Probably only informative for interdomain rotations greater than 20 degrees
Residue
iResidue
i+1Distance of hinge axis to residue i in
(A) Distance of hinge axis to residue i in
(A) Change in
(deg) Change in
(deg) Angle of psi(i) axis to hinge axis
(deg) Angle of psi(i) axis to hinge axis
(deg) Percentage Progress
LYS-309
ARG-310
6.8
8.0
35.4
-8.5
53.5
42.0
219.7
ARG-310
ILE-311
4.7
6.9
12.2
-37.1
75.6
89.7
-1.1
ILE-311
TRP-312
5.0
6.3
-1.1
-8.0
159.9
159.7
-59.2
TRP-312
THR-313
6.5
7.1
2.0
21.0
89.6
83.6
-32.8
THR-313
GLU-314
9.3
9.3
10.1
-20.5
32.3
35.6
-71.0

Graph shows rotational transition at bending residues and can be used
to identify hinge bending residues.
Probably only informative for interdomain rotations greater than 20 degrees
Residue
iResidue
i+1Distance of hinge axis to residue i in
(A) Distance of hinge axis to residue i in
(A) Change in
(deg) Change in
(deg) Angle of psi(i) axis to hinge axis
(deg) Angle of psi(i) axis to hinge axis
(deg) Percentage Progress
PRO-377
TYR-378
31.2
31.5
-20.2
21.5
74.2
82.8
-14.7
TYR-378
GLN-379
28.2
28.4
14.4
-6.6
157.5
152.5
3.8
GLN-379
ILE-380
26.3
26.4
2.6
42.9
101.8
117.4
-295.3
ILE-380
VAL-381
23.9
25.3
-27.5
-29.5
54.0
67.0
275.7
VAL-381
GLY-382
20.7
21.8
-84.4
107.6
45.2
53.3
-187.3
GLY-382
GLY-383
19.1
21.9
-100.4
127.9
72.6
59.6
-38.0
GLY-383
LEU-384
21.7
25.6
157.9
56.4
113.7
137.3
954.1
LEU-384
LYS-385
23.5
28.9
123.5
148.0
121.3
95.3
428.1
LYS-385
PHE-386
21.6
32.1
-114.0
-106.5
50.0
40.0
-1202.9
PHE-386
TYR-387
23.9
29.7
37.2
-63.7
160.2
133.8
311.6
TYR-387
ASP-388
21.9
26.7
-105.2
41.1
77.8
47.2
199.1
ASP-388
ARG-389
22.2
24.8
61.5
-24.1
89.4
84.0
-147.2
ARG-389
LYS-390
25.9
28.0
-9.2
22.1
16.3
17.7
-72.5

Graph shows rotational transition at bending residues and can be used
to identify hinge bending residues.
Probably only informative for interdomain rotations greater than 20 degrees