Beta-Actin
(All numbering and residues are taken from first PDB file)
![]()
![]()
Bending Residue Dihedral Analysis
Residue
iResidue
i+1Distance of hinge axis to residue i in
(A) Distance of hinge axis to residue i in
(A) Change in
(deg) Change in
(deg) Angle of psi(i) axis to hinge axis
(deg) Angle of psi(i) axis to hinge axis
(deg) Percentage Progress
LYS-18
ALA-19
4.0
4.2
-31.1
29.2
45.7
45.1
31.0
ALA-19
GLY-20
2.6
2.9
2.1
-2.3
123.3
119.3
-2.0
GLY-20
PHE-21
4.4
4.9
-17.1
19.2
71.6
64.3
-1.8

Graph shows rotational transition at bending residues and can be used
to identify hinge bending residues.
Probably only informative for interdomain rotations greater than 20 degrees
Residue
iResidue
i+1Distance of hinge axis to residue i in
(A) Distance of hinge axis to residue i in
(A) Change in
(deg) Change in
(deg) Angle of psi(i) axis to hinge axis
(deg) Angle of psi(i) axis to hinge axis
(deg) Percentage Progress
ALA-29
VAL-30
7.4
7.5
-2.6
-10.6
23.5
21.7
46.7
VAL-30
PHE-31
8.5
8.6
19.0
-22.0
85.5
89.6
-33.7
PHE-31
PRO-32
10.5
10.6
-12.7
-7.9
51.0
48.7
80.0

Graph shows rotational transition at bending residues and can be used
to identify hinge bending residues.
Probably only informative for interdomain rotations greater than 20 degrees
Residue
iResidue
i+1Distance of hinge axis to residue i in
(A) Distance of hinge axis to residue i in
(A) Change in
(deg) Change in
(deg) Angle of psi(i) axis to hinge axis
(deg) Angle of psi(i) axis to hinge axis
(deg) Percentage Progress
PRO-102
THR-103
9.6
9.2
58.1
-25.8
48.8
57.4
64.8
THR-103
LEU-104
7.3
7.2
-0.4
-10.0
159.5
164.3
-29.6
LEU-104
LEU-105
7.5
6.7
-10.8
-4.9
115.2
122.8
-46.8
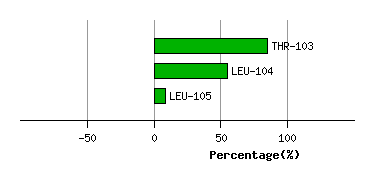
Graph shows rotational transition at bending residues and can be used
to identify hinge bending residues.
Probably only informative for interdomain rotations greater than 20 degrees
Residue
iResidue
i+1Distance of hinge axis to residue i in
(A) Distance of hinge axis to residue i in
(A) Change in
(deg) Change in
(deg) Angle of psi(i) axis to hinge axis
(deg) Angle of psi(i) axis to hinge axis
(deg) Percentage Progress
GLU-107
ALA-108
8.0
8.3
-37.3
2.4
12.3
28.5
205.7
ALA-108
PRO-109
7.8
8.3
-50.7
17.6
55.1
50.9
5.9
PRO-109
LEU-110
9.0
9.7
-10.3
-4.9
83.4
74.8
13.7

Graph shows rotational transition at bending residues and can be used
to identify hinge bending residues.
Probably only informative for interdomain rotations greater than 20 degrees
Residue
iResidue
i+1Distance of hinge axis to residue i in
(A) Distance of hinge axis to residue i in
(A) Change in
(deg) Change in
(deg) Angle of psi(i) axis to hinge axis
(deg) Angle of psi(i) axis to hinge axis
(deg) Percentage Progress
VAL-134
ALA-135
10.8
9.8
-34.6
49.2
147.1
152.2
61.9
ALA-135
ILE-136
9.7
9.3
17.6
-15.0
46.1
37.5
46.8
ILE-136
GLN-137
8.5
8.4
-21.3
47.0
97.8
106.5
42.9

Graph shows rotational transition at bending residues and can be used
to identify hinge bending residues.
Probably only informative for interdomain rotations greater than 20 degrees
Residue
iResidue
i+1Distance of hinge axis to residue i in
(A) Distance of hinge axis to residue i in
(A) Change in
(deg) Change in
(deg) Angle of psi(i) axis to hinge axis
(deg) Angle of psi(i) axis to hinge axis
(deg) Percentage Progress
ALA-138
VAL-139
5.2
5.0
-12.3
19.7
97.2
100.7
34.9
VAL-139
LEU-140
8.7
8.7
8.2
-6.5
50.2
50.7
27.3
LEU-140
SER-141
7.7
8.2
3.9
0.2
118.3
111.8
-32.5
SER-141
LEU-142
6.5
7.6
16.3
-4.7
124.8
122.9
-41.0
LEU-142
TYR-143
9.4
10.5
-5.8
-9.8
125.3
120.3
-9.1
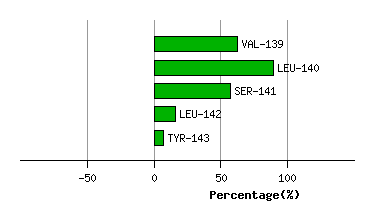
Graph shows rotational transition at bending residues and can be used
to identify hinge bending residues.
Probably only informative for interdomain rotations greater than 20 degrees
Residue
iResidue
i+1Distance of hinge axis to residue i in
(A) Distance of hinge axis to residue i in
(A) Change in
(deg) Change in
(deg) Angle of psi(i) axis to hinge axis
(deg) Angle of psi(i) axis to hinge axis
(deg) Percentage Progress
LYS-336
TYR-337
8.2
8.4
-13.0
24.8
140.1
135.5
61.0
TYR-337
SER-338
6.7
7.8
4.0
9.0
100.7
108.9
10.8
SER-338
VAL-339
6.7
7.5
-5.8
-20.6
107.8
116.3
-2.9

Graph shows rotational transition at bending residues and can be used
to identify hinge bending residues.
Probably only informative for interdomain rotations greater than 20 degrees