Sucrose Hydrolase
(All numbering and residues are taken from first PDB file)
![]()
![]()
Bending Residue Dihedral Analysis
Residue
iResidue
i+1Distance of hinge axis to residue i in
(A) Distance of hinge axis to residue i in
(A) Change in
(deg) Change in
(deg) Angle of psi(i) axis to hinge axis
(deg) Angle of psi(i) axis to hinge axis
(deg) Percentage Progress
ARG-81
HIS-82
6.9
6.8
7.2
-3.2
41.3
32.4
82.7
HIS-82
ALA-83
4.8
4.9
-15.2
3.2
78.5
80.0
44.6
ALA-83
GLY-84
1.6
1.6
4.8
-10.9
74.0
75.4
-60.8
GLY-84
TRP-85
2.3
2.3
7.7
-1.2
111.5
110.0
-99.3

Graph shows rotational transition at bending residues and can be used
to identify hinge bending residues.
Probably only informative for interdomain rotations greater than 20 degrees
Residue
iResidue
i+1Distance of hinge axis to residue i in
(A) Distance of hinge axis to residue i in
(A) Change in
(deg) Change in
(deg) Angle of psi(i) axis to hinge axis
(deg) Angle of psi(i) axis to hinge axis
(deg) Percentage Progress
TYR-122
LEU-123
10.0
10.2
4.3
-7.7
34.1
33.5
-111.0
LEU-123
HIS-124
10.6
10.7
3.9
-2.8
64.3
62.8
74.9
HIS-124
LEU-125
10.1
10.1
0.3
0.2
18.9
17.4
-17.8
LEU-125
LEU-126
10.0
10.0
-4.1
3.6
106.9
107.5
69.2
LEU-126
PRO-127
11.4
11.4
0.4
-1.7
44.5
45.5
-84.3
PRO-127
PHE-128
9.7
9.8
9.4
-9.4
41.1
43.3
-60.0

Graph shows rotational transition at bending residues and can be used
to identify hinge bending residues.
Probably only informative for interdomain rotations greater than 20 degrees
Residue
iResidue
i+1Distance of hinge axis to residue i in
(A) Distance of hinge axis to residue i in
(A) Change in
(deg) Change in
(deg) Angle of psi(i) axis to hinge axis
(deg) Angle of psi(i) axis to hinge axis
(deg) Percentage Progress
LEU-158
VAL-159
5.8
5.8
-1.5
0.0
132.6
133.9
-51.5
VAL-159
ALA-160
7.7
7.6
-1.2
0.4
101.0
102.0
16.5
ALA-160
LEU-161
10.9
10.8
-0.4
2.0
125.5
125.1
68.3
LEU-161
THR-162
9.9
9.9
1.1
-0.6
17.1
15.1
53.5
THR-162
SER-163
8.1
8.1
2.9
-5.8
64.1
62.4
-73.7

Graph shows rotational transition at bending residues and can be used
to identify hinge bending residues.
Probably only informative for interdomain rotations greater than 20 degrees
Residue
iResidue
i+1Distance of hinge axis to residue i in
(A) Distance of hinge axis to residue i in
(A) Change in
(deg) Change in
(deg) Angle of psi(i) axis to hinge axis
(deg) Angle of psi(i) axis to hinge axis
(deg) Percentage Progress
VAL-318
MET-319
3.4
3.4
-6.6
-3.0
51.9
54.8
132.7
MET-319
LYS-320
7.0
7.1
-4.4
5.1
108.5
110.7
24.3
LYS-320
ALA-321
9.5
9.6
-4.8
-3.5
65.0
67.0
45.3

Graph shows rotational transition at bending residues and can be used
to identify hinge bending residues.
Probably only informative for interdomain rotations greater than 20 degrees
Residue
iResidue
i+1Distance of hinge axis to residue i in
(A) Distance of hinge axis to residue i in
(A) Change in
(deg) Change in
(deg) Angle of psi(i) axis to hinge axis
(deg) Angle of psi(i) axis to hinge axis
(deg) Percentage Progress
PRO-332
TYR-333
18.5
18.4
12.1
-4.1
49.0
44.2
147.2
TYR-333
PHE-334
15.8
15.9
8.2
-0.9
117.1
116.7
-135.2
PHE-334
GLY-335
13.2
13.3
-5.1
1.2
69.0
67.6
38.9
GLY-335
SER-336
15.3
15.3
14.5
-20.5
139.8
143.2
115.3
SER-336
GLY-337
18.4
18.1
-0.9
-5.5
53.8
60.1
102.7
GLY-337
VAL-338
19.1
18.8
-3.5
11.2
91.2
102.0
-80.2
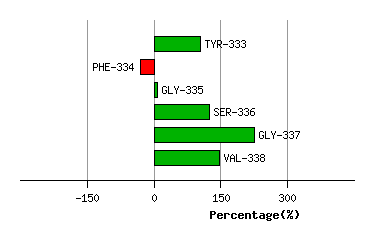
Graph shows rotational transition at bending residues and can be used
to identify hinge bending residues.
Probably only informative for interdomain rotations greater than 20 degrees
Residue
iResidue
i+1Distance of hinge axis to residue i in
(A) Distance of hinge axis to residue i in
(A) Change in
(deg) Change in
(deg) Angle of psi(i) axis to hinge axis
(deg) Angle of psi(i) axis to hinge axis
(deg) Percentage Progress
HIS-342
GLU-343
11.5
11.5
5.4
1.8
29.8
30.9
207.5
GLU-343
CYS-344
12.0
12.2
4.7
-3.6
67.2
65.7
35.5
CYS-344
HIS-345
10.3
10.5
-2.2
0.9
44.6
46.0
-14.9
HIS-345
LEU-346
7.5
7.6
7.4
-7.1
92.4
89.8
-36.2

Graph shows rotational transition at bending residues and can be used
to identify hinge bending residues.
Probably only informative for interdomain rotations greater than 20 degrees
Residue
iResidue
i+1Distance of hinge axis to residue i in
(A) Distance of hinge axis to residue i in
(A) Change in
(deg) Change in
(deg) Angle of psi(i) axis to hinge axis
(deg) Angle of psi(i) axis to hinge axis
(deg) Percentage Progress
PRO-379
ARG-380
10.6
10.6
6.2
6.4
87.3
84.4
143.9
ARG-380
HIS-381
6.9
6.9
-11.9
-3.4
160.5
159.7
-375.5
HIS-381
CYS-382
4.9
4.8
7.9
5.1
40.6
42.5
214.2
CYS-382
ALA-383
8.0
8.1
8.5
-12.3
96.6
94.1
-58.1

Graph shows rotational transition at bending residues and can be used
to identify hinge bending residues.
Probably only informative for interdomain rotations greater than 20 degrees