Glutamate Receptor, Ionotropic Kainate 2
(All numbering and residues are taken from first PDB file)
![]()
![]()
Bending Residue Dihedral Analysis
Residue
iResidue
i+1Distance of hinge axis to residue i in
(A) Distance of hinge axis to residue i in
(A) Change in
(deg) Change in
(deg) Angle of psi(i) axis to hinge axis
(deg) Angle of psi(i) axis to hinge axis
(deg) Percentage Progress
THR-535
LEU-536
6.1
5.9
12.1
-5.0
46.2
43.3
30.4
LEU-536
GLY-537
2.9
2.6
-14.1
-12.1
66.8
62.3
54.3
GLY-537
ILE-538
1.4
1.3
8.5
4.6
41.8
43.3
20.8

Graph shows rotational transition at bending residues and can be used
to identify hinge bending residues.
Probably only informative for interdomain rotations greater than 20 degrees
Residue
iResidue
i+1Distance of hinge axis to residue i in
(A) Distance of hinge axis to residue i in
(A) Change in
(deg) Change in
(deg) Angle of psi(i) axis to hinge axis
(deg) Angle of psi(i) axis to hinge axis
(deg) Percentage Progress
TYR-542
ARG-543
8.9
9.3
-24.2
0.7
38.2
22.7
121.4
ARG-543
LYS-544
9.6
9.2
-19.8
32.1
104.7
85.2
2.0
LYS-544
GLY-555
11.1
10.3
-36.2
28.0
72.8
71.1
43.3

Graph shows rotational transition at bending residues and can be used
to identify hinge bending residues.
Probably only informative for interdomain rotations greater than 20 degrees
Residue
iResidue
i+1Distance of hinge axis to residue i in
(A) Distance of hinge axis to residue i in
(A) Change in
(deg) Change in
(deg) Angle of psi(i) axis to hinge axis
(deg) Angle of psi(i) axis to hinge axis
(deg) Percentage Progress
THR-566
PRO-667
16.4
14.9
-40.5
6.2
32.6
39.9
108.8
PRO-667
ILE-668
18.7
17.6
71.4
-70.2
142.0
158.7
-44.0
ILE-668
ASP-669
16.3
15.7
10.6
1.0
118.0
110.6
19.7

Graph shows rotational transition at bending residues and can be used
to identify hinge bending residues.
Probably only informative for interdomain rotations greater than 20 degrees
Residue
iResidue
i+1Distance of hinge axis to residue i in
(A) Distance of hinge axis to residue i in
(A) Change in
(deg) Change in
(deg) Angle of psi(i) axis to hinge axis
(deg) Angle of psi(i) axis to hinge axis
(deg) Percentage Progress
SER-739
THR-740
0.5
0.3
-3.8
0.4
62.5
57.1
6.1
THR-740
THR-741
4.0
3.5
0.3
-3.1
156.7
156.4
1.2
THR-741
ILE-742
4.3
3.5
4.5
-11.1
125.8
123.7
36.4

Graph shows rotational transition at bending residues and can be used
to identify hinge bending residues.
Probably only informative for interdomain rotations greater than 20 degrees
Residue
iResidue
i+1Distance of hinge axis to residue i in
(A) Distance of hinge axis to residue i in
(A) Change in
(deg) Change in
(deg) Angle of psi(i) axis to hinge axis
(deg) Angle of psi(i) axis to hinge axis
(deg) Percentage Progress
GLU-743
PHE-744
3.4
3.2
15.3
-10.4
38.4
48.5
22.0
PHE-744
VAL-745
4.9
4.3
-5.0
6.6
145.9
153.0
9.6
VAL-745
THR-746
2.1
1.7
15.8
1.9
67.2
66.2
54.8
THR-746
GLN-747
2.7
3.2
6.8
-38.3
118.6
124.3
71.6
THR-746
GLN-747
2.7
3.2
6.8
-38.3
118.6
124.3
71.6

Graph shows rotational transition at bending residues and can be used
to identify hinge bending residues.
Probably only informative for interdomain rotations greater than 20 degrees
Residue
iResidue
i+1Distance of hinge axis to residue i in
(A) Distance of hinge axis to residue i in
(A) Change in
(deg) Change in
(deg) Angle of psi(i) axis to hinge axis
(deg) Angle of psi(i) axis to hinge axis
(deg) Percentage Progress
THR-746
GLN-747
2.7
3.2
6.8
-38.3
118.6
124.3
71.6
THR-746
GLN-747
2.7
3.2
6.8
-38.3
118.6
124.3
71.6
GLN-747
ARG-748
5.5
5.5
42.5
-6.6
158.9
134.4
-167.4
ARG-748
ASN-749
4.0
4.0
159.1
56.1
123.3
139.7
516.3
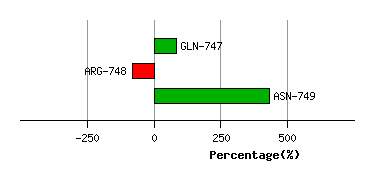
Graph shows rotational transition at bending residues and can be used
to identify hinge bending residues.
Probably only informative for interdomain rotations greater than 20 degrees
Residue
iResidue
i+1Distance of hinge axis to residue i in
(A) Distance of hinge axis to residue i in
(A) Change in
(deg) Change in
(deg) Angle of psi(i) axis to hinge axis
(deg) Angle of psi(i) axis to hinge axis
(deg) Percentage Progress
CYS-750
ASN-751
5.4
3.8
52.7
-25.5
92.2
93.4
-18.9
ASN-751
LEU-752
6.4
5.4
17.0
-7.1
152.6
155.2
-34.3
LEU-752
THR-753
5.5
5.2
-0.1
6.1
42.2
52.8
-19.3
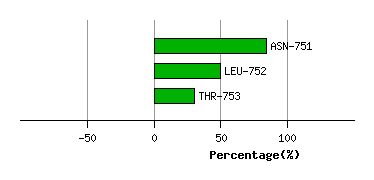
Graph shows rotational transition at bending residues and can be used
to identify hinge bending residues.
Probably only informative for interdomain rotations greater than 20 degrees
Residue
iResidue
i+1Distance of hinge axis to residue i in
(A) Distance of hinge axis to residue i in
(A) Change in
(deg) Change in
(deg) Angle of psi(i) axis to hinge axis
(deg) Angle of psi(i) axis to hinge axis
(deg) Percentage Progress
LEU-758
ILE-759
5.1
5.5
12.1
1.2
50.7
46.3
37.4
ILE-759
ASP-760
6.9
6.9
4.5
-6.8
31.6
33.2
-5.3
ASP-760
SER-761
4.4
4.2
-10.6
8.8
86.9
84.3
17.6
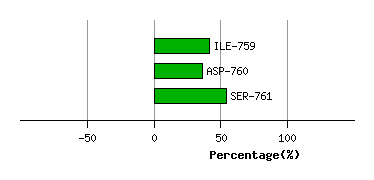
Graph shows rotational transition at bending residues and can be used
to identify hinge bending residues.
Probably only informative for interdomain rotations greater than 20 degrees