Beta-Actin
(All numbering and residues are taken from first PDB file)
![]()
![]()
Bending Residue Dihedral Analysis
Residue
iResidue
i+1Distance of hinge axis to residue i in
(A) Distance of hinge axis to residue i in
(A) Change in
(deg) Change in
(deg) Angle of psi(i) axis to hinge axis
(deg) Angle of psi(i) axis to hinge axis
(deg) Percentage Progress
LEU-8
VAL-9
0.8
1.7
-23.4
27.2
157.8
155.7
-12.7
VAL-9
CYS-10
0.2
1.0
-10.8
1.1
102.5
98.6
77.2
CYS-10
ASP-11
3.6
2.8
7.0
-6.7
21.3
30.3
22.1
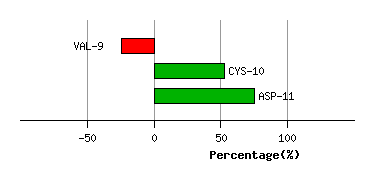
Graph shows rotational transition at bending residues and can be used
to identify hinge bending residues.
Probably only informative for interdomain rotations greater than 20 degrees
Residue
iResidue
i+1Distance of hinge axis to residue i in
(A) Distance of hinge axis to residue i in
(A) Change in
(deg) Change in
(deg) Angle of psi(i) axis to hinge axis
(deg) Angle of psi(i) axis to hinge axis
(deg) Percentage Progress
ASN-12
GLY-13
8.0
7.3
-9.5
40.3
22.5
26.1
-128.5
GLY-13
SER-14
8.9
8.3
-6.8
-31.2
79.0
64.6
161.9
SER-14
GLY-15
12.0
10.8
5.0
31.1
78.7
86.7
75.5
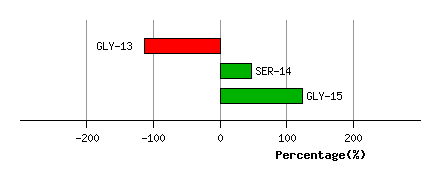
Graph shows rotational transition at bending residues and can be used
to identify hinge bending residues.
Probably only informative for interdomain rotations greater than 20 degrees
Residue
iResidue
i+1Distance of hinge axis to residue i in
(A) Distance of hinge axis to residue i in
(A) Change in
(deg) Change in
(deg) Angle of psi(i) axis to hinge axis
(deg) Angle of psi(i) axis to hinge axis
(deg) Percentage Progress
GLY-23
ASP-24
9.4
9.7
-166.9
-49.0
101.0
71.2
-639.7
ASP-24
ASP-25
9.7
11.9
130.1
8.2
4.6
34.4
719.2
ASP-25
ALA-26
11.0
12.7
-29.3
-7.1
121.1
114.0
-103.4
ALA-26
PRO-27
9.4
10.3
3.8
8.9
43.6
43.6
54.3
ALA-26
PRO-27
9.4
10.3
3.8
8.9
43.6
43.6
54.3

Graph shows rotational transition at bending residues and can be used
to identify hinge bending residues.
Probably only informative for interdomain rotations greater than 20 degrees
Residue
iResidue
i+1Distance of hinge axis to residue i in
(A) Distance of hinge axis to residue i in
(A) Change in
(deg) Change in
(deg) Angle of psi(i) axis to hinge axis
(deg) Angle of psi(i) axis to hinge axis
(deg) Percentage Progress
ALA-26
PRO-27
9.4
10.3
3.8
8.9
43.6
43.6
54.3
ALA-26
PRO-27
9.4
10.3
3.8
8.9
43.6
43.6
54.3
PRO-27
ARG-28
7.8
8.1
6.4
-4.0
61.3
56.3
17.6
ARG-28
ALA-29
10.1
10.2
5.6
-14.3
93.8
92.5
9.1

Graph shows rotational transition at bending residues and can be used
to identify hinge bending residues.
Probably only informative for interdomain rotations greater than 20 degrees
Residue
iResidue
i+1Distance of hinge axis to residue i in
(A) Distance of hinge axis to residue i in
(A) Change in
(deg) Change in
(deg) Angle of psi(i) axis to hinge axis
(deg) Angle of psi(i) axis to hinge axis
(deg) Percentage Progress
LYS-84
ILE-85
16.6
16.8
4.4
11.9
66.9
67.9
-35.9
ILE-85
TRP-86
14.0
14.4
-10.0
8.2
60.1
57.5
-12.3
TRP-86
HIS-87
11.1
11.5
-18.5
7.9
23.5
23.5
51.8

Graph shows rotational transition at bending residues and can be used
to identify hinge bending residues.
Probably only informative for interdomain rotations greater than 20 degrees
Residue
iResidue
i+1Distance of hinge axis to residue i in
(A) Distance of hinge axis to residue i in
(A) Change in
(deg) Change in
(deg) Angle of psi(i) axis to hinge axis
(deg) Angle of psi(i) axis to hinge axis
(deg) Percentage Progress
THR-89
PHE-90
9.8
10.8
-3.3
8.6
145.6
139.5
14.7
PHE-90
TYR-91
8.0
8.4
4.0
8.9
46.5
38.7
36.2
TYR-91
ASN-92
10.5
10.9
-22.7
1.1
79.2
81.5
-18.7
ASN-92
GLU-93
13.1
13.7
45.7
-30.5
56.0
45.4
-3.7
ASN-92
GLU-93
13.1
13.7
45.7
-30.5
56.0
45.4
-3.7

Graph shows rotational transition at bending residues and can be used
to identify hinge bending residues.
Probably only informative for interdomain rotations greater than 20 degrees
Residue
iResidue
i+1Distance of hinge axis to residue i in
(A) Distance of hinge axis to residue i in
(A) Change in
(deg) Change in
(deg) Angle of psi(i) axis to hinge axis
(deg) Angle of psi(i) axis to hinge axis
(deg) Percentage Progress
ASN-92
GLU-93
13.1
13.7
45.7
-30.5
56.0
45.4
-3.7
ASN-92
GLU-93
13.1
13.7
45.7
-30.5
56.0
45.4
-3.7
GLU-93
LEU-94
11.6
12.2
-22.7
23.6
68.7
65.2
-20.1
LEU-94
ARG-95
8.4
8.8
-17.9
11.1
6.6
11.6
32.0
ARG-95
VAL-96
9.0
8.7
-6.4
-5.7
63.8
72.5
26.6

Graph shows rotational transition at bending residues and can be used
to identify hinge bending residues.
Probably only informative for interdomain rotations greater than 20 degrees
Residue
iResidue
i+1Distance of hinge axis to residue i in
(A) Distance of hinge axis to residue i in
(A) Change in
(deg) Change in
(deg) Angle of psi(i) axis to hinge axis
(deg) Angle of psi(i) axis to hinge axis
(deg) Percentage Progress
ALA-97
PRO-98
4.5
4.2
24.0
1.1
54.7
50.7
48.6
PRO-98
GLU-99
4.7
5.3
-9.3
-2.1
67.9
66.0
21.4
GLU-99
GLU-100
5.6
5.8
-7.1
2.8
80.6
85.9
-11.1

Graph shows rotational transition at bending residues and can be used
to identify hinge bending residues.
Probably only informative for interdomain rotations greater than 20 degrees
Residue
iResidue
i+1Distance of hinge axis to residue i in
(A) Distance of hinge axis to residue i in
(A) Change in
(deg) Change in
(deg) Angle of psi(i) axis to hinge axis
(deg) Angle of psi(i) axis to hinge axis
(deg) Percentage Progress
LEU-105
THR-106
6.0
5.8
10.6
-16.0
165.0
165.1
8.7
THR-106
GLU-107
5.9
6.2
5.2
-4.7
111.2
111.8
9.3
GLU-107
ALA-108
8.9
9.1
32.7
-29.4
174.0
170.0
26.6

Graph shows rotational transition at bending residues and can be used
to identify hinge bending residues.
Probably only informative for interdomain rotations greater than 20 degrees
Residue
iResidue
i+1Distance of hinge axis to residue i in
(A) Distance of hinge axis to residue i in
(A) Change in
(deg) Change in
(deg) Angle of psi(i) axis to hinge axis
(deg) Angle of psi(i) axis to hinge axis
(deg) Percentage Progress
ALA-114
ASN-115
20.8
20.8
60.0
18.0
107.1
105.3
-110.4
ASN-115
ARG-116
17.8
17.8
12.5
-28.2
122.4
120.0
62.8
ARG-116
GLU-117
15.4
15.4
3.3
2.8
155.7
151.5
-13.1

Graph shows rotational transition at bending residues and can be used
to identify hinge bending residues.
Probably only informative for interdomain rotations greater than 20 degrees
Residue
iResidue
i+1Distance of hinge axis to residue i in
(A) Distance of hinge axis to residue i in
(A) Change in
(deg) Change in
(deg) Angle of psi(i) axis to hinge axis
(deg) Angle of psi(i) axis to hinge axis
(deg) Percentage Progress
GLU-125
THR-126
15.7
16.2
11.6
-2.0
75.1
68.5
29.2
THR-126
PHE-127
14.6
15.1
-6.8
3.2
111.2
112.7
-11.3
PHE-127
ASN-128
10.8
11.3
-8.5
7.6
123.5
117.0
-7.3
ASN-128
VAL-129
10.6
11.2
3.1
8.6
105.2
97.8
-8.1

Graph shows rotational transition at bending residues and can be used
to identify hinge bending residues.
Probably only informative for interdomain rotations greater than 20 degrees
Residue
iResidue
i+1Distance of hinge axis to residue i in
(A) Distance of hinge axis to residue i in
(A) Change in
(deg) Change in
(deg) Angle of psi(i) axis to hinge axis
(deg) Angle of psi(i) axis to hinge axis
(deg) Percentage Progress
ALA-131
MET-132
10.0
9.9
-7.8
2.8
36.1
36.0
-65.7
MET-132
TYR-133
9.3
9.4
-23.5
12.6
35.8
33.9
120.9
TYR-133
VAL-134
9.8
9.8
3.9
-2.8
134.4
130.5
-12.0

Graph shows rotational transition at bending residues and can be used
to identify hinge bending residues.
Probably only informative for interdomain rotations greater than 20 degrees
Residue
iResidue
i+1Distance of hinge axis to residue i in
(A) Distance of hinge axis to residue i in
(A) Change in
(deg) Change in
(deg) Angle of psi(i) axis to hinge axis
(deg) Angle of psi(i) axis to hinge axis
(deg) Percentage Progress
VAL-139
LEU-140
6.9
7.3
-0.7
-1.8
55.4
56.4
-10.3
LEU-140
SER-141
4.9
5.2
9.7
-6.5
55.4
55.4
8.9
SER-141
LEU-142
3.5
4.4
24.3
-4.0
57.8
63.0
53.7
LEU-142
TYR-143
6.6
8.0
1.5
-3.8
126.0
122.2
9.2
TYR-143
ALA-144
8.7
9.4
-1.7
-1.8
80.1
97.8
20.2
ALA-144
SER-145
7.8
8.2
-14.5
30.9
139.3
151.7
82.9

Graph shows rotational transition at bending residues and can be used
to identify hinge bending residues.
Probably only informative for interdomain rotations greater than 20 degrees
Residue
iResidue
i+1Distance of hinge axis to residue i in
(A) Distance of hinge axis to residue i in
(A) Change in
(deg) Change in
(deg) Angle of psi(i) axis to hinge axis
(deg) Angle of psi(i) axis to hinge axis
(deg) Percentage Progress
ARG-335
LYS-336
7.3
7.7
-10.5
3.9
108.3
129.7
25.2
LYS-336
TYR-337
8.2
8.3
2.7
10.7
32.9
30.3
87.1
TYR-337
SER-338
6.4
7.2
-13.2
16.0
85.3
78.4
3.0
SER-338
VAL-339
4.6
5.2
-28.7
13.1
114.1
124.0
0.4
VAL-339
TRP-340
1.0
1.8
1.9
-4.4
14.0
21.3
-14.5
TRP-340
ILE-341
2.4
3.5
0.8
-3.5
80.6
85.2
4.4

Graph shows rotational transition at bending residues and can be used
to identify hinge bending residues.
Probably only informative for interdomain rotations greater than 20 degrees
Residue
iResidue
i+1Distance of hinge axis to residue i in
(A) Distance of hinge axis to residue i in
(A) Change in
(deg) Change in
(deg) Angle of psi(i) axis to hinge axis
(deg) Angle of psi(i) axis to hinge axis
(deg) Percentage Progress
PHE-352
GLN-353
15.8
15.5
-26.8
5.7
53.0
53.3
189.5
GLN-353
GLN-354
14.1
13.3
-9.8
-25.8
85.7
61.7
88.2
GLN-354
MET-355
16.7
16.3
31.7
-36.9
42.3
47.9
-122.4
MET-355
TRP-356
15.1
16.3
31.9
-21.1
109.7
93.3
8.3
TRP-356
ILE-357
12.5
13.2
3.5
21.4
106.5
122.8
-58.0

Graph shows rotational transition at bending residues and can be used
to identify hinge bending residues.
Probably only informative for interdomain rotations greater than 20 degrees