Ferredoxin:nadp+ Oxidoreductase (Ferredoxin Reductase, 3 Flavoenzyme) (E.C.1.18.1.2)
(All numbering and residues are taken from first PDB file)
![]()
![]()
Bending Residue Dihedral Analysis
Residue
iResidue
i+1Distance of hinge axis to residue i in
(A) Distance of hinge axis to residue i in
(A) Change in
(deg) Change in
(deg) Angle of psi(i) axis to hinge axis
(deg) Angle of psi(i) axis to hinge axis
(deg) Percentage Progress
ALA-198
TRP-199
12.7
12.8
3.3
-2.3
123.0
122.8
51.4
TRP-199
LEU-200
9.4
9.4
-4.0
0.6
83.2
83.5
17.0
LEU-200
PHE-201
7.2
7.2
-1.7
0.6
69.4
66.7
-51.9
PHE-201
LEU-202
3.4
3.5
-1.4
3.5
72.9
73.9
83.0

Graph shows rotational transition at bending residues and can be used
to identify hinge bending residues.
Probably only informative for interdomain rotations greater than 20 degrees
Residue
iResidue
i+1Distance of hinge axis to residue i in
(A) Distance of hinge axis to residue i in
(A) Change in
(deg) Change in
(deg) Angle of psi(i) axis to hinge axis
(deg) Angle of psi(i) axis to hinge axis
(deg) Percentage Progress
SER-207
SER-208
4.2
4.4
-4.1
3.7
108.3
104.1
-109.9
SER-208
SER-209
7.6
7.7
-6.4
6.8
35.9
37.8
16.3
SER-209
LEU-210
8.6
8.8
-3.6
3.4
56.1
58.8
-6.4
LEU-210
LEU-211
6.7
6.9
34.9
-35.0
98.2
92.0
124.5
LEU-211
TYR-212
10.1
10.1
0.3
3.9
99.7
96.0
28.0
TYR-212
LYS-213
12.0
11.9
2.3
-3.8
82.2
82.5
53.6

Graph shows rotational transition at bending residues and can be used
to identify hinge bending residues.
Probably only informative for interdomain rotations greater than 20 degrees
Residue
iResidue
i+1Distance of hinge axis to residue i in
(A) Distance of hinge axis to residue i in
(A) Change in
(deg) Change in
(deg) Angle of psi(i) axis to hinge axis
(deg) Angle of psi(i) axis to hinge axis
(deg) Percentage Progress
ASP-230
PHE-231
4.8
4.9
-3.2
-1.7
80.5
81.1
86.5
PHE-231
ALA-232
1.6
1.7
-0.4
-1.7
97.2
95.1
-8.5
ALA-232
VAL-233
2.2
2.1
9.1
-8.5
126.0
124.9
101.0

Graph shows rotational transition at bending residues and can be used
to identify hinge bending residues.
Probably only informative for interdomain rotations greater than 20 degrees
Residue
iResidue
i+1Distance of hinge axis to residue i in
(A) Distance of hinge axis to residue i in
(A) Change in
(deg) Change in
(deg) Angle of psi(i) axis to hinge axis
(deg) Angle of psi(i) axis to hinge axis
(deg) Percentage Progress
THR-249
ARG-250
7.4
7.5
-0.1
-1.7
107.7
109.2
112.1
ARG-250
MET-251
5.4
5.5
1.4
-1.3
140.4
142.1
-96.0
MET-251
ALA-252
5.1
5.1
-4.2
3.4
72.3
71.6
106.0

Graph shows rotational transition at bending residues and can be used
to identify hinge bending residues.
Probably only informative for interdomain rotations greater than 20 degrees
Residue
iResidue
i+1Distance of hinge axis to residue i in
(A) Distance of hinge axis to residue i in
(A) Change in
(deg) Change in
(deg) Angle of psi(i) axis to hinge axis
(deg) Angle of psi(i) axis to hinge axis
(deg) Percentage Progress
LYS-275
GLY-276
12.8
12.9
-3.9
-2.2
86.1
87.2
-85.4
GLY-276
MET-277
12.2
12.2
6.5
0.6
86.2
87.5
4.1
MET-277
GLU-278
8.4
8.5
3.1
-0.1
21.7
25.4
134.4
GLU-278
LYS-279
7.9
8.0
-2.4
5.3
110.4
104.8
-117.8
LYS-279
GLY-280
9.8
9.9
-8.0
-1.7
62.0
63.9
105.6
GLY-280
ILE-281
8.9
9.0
12.3
-6.0
108.8
106.9
-6.1
GLY-280
ILE-281
8.9
9.0
12.3
-6.0
108.8
106.9
-6.1
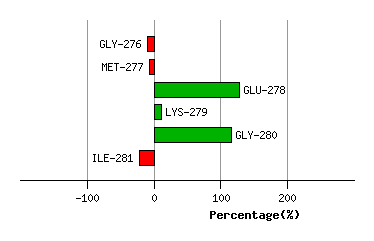
Graph shows rotational transition at bending residues and can be used
to identify hinge bending residues.
Probably only informative for interdomain rotations greater than 20 degrees
Residue
iResidue
i+1Distance of hinge axis to residue i in
(A) Distance of hinge axis to residue i in
(A) Change in
(deg) Change in
(deg) Angle of psi(i) axis to hinge axis
(deg) Angle of psi(i) axis to hinge axis
(deg) Percentage Progress
GLY-280
ILE-281
8.9
9.0
12.3
-6.0
108.8
106.9
-6.1
GLY-280
ILE-281
8.9
9.0
12.3
-6.0
108.8
106.9
-6.1
ILE-281
ASP-282
5.5
5.5
-0.7
-2.4
24.3
23.3
58.3
ASP-282
ASP-283
6.7
6.6
-1.2
-3.7
93.3
91.5
62.6

Graph shows rotational transition at bending residues and can be used
to identify hinge bending residues.
Probably only informative for interdomain rotations greater than 20 degrees