Ferric-Iron Binding Protein
(All numbering and residues are taken from first PDB file)
![]()
![]()
Bending Residue Dihedral Analysis
Residue
iResidue
i+1Distance of hinge axis to residue i in
(A) Distance of hinge axis to residue i in
(A) Change in
(deg) Change in
(deg) Angle of psi(i) axis to hinge axis
(deg) Angle of psi(i) axis to hinge axis
(deg) Percentage Progress
GLY-100
ARG-101
4.8
4.9
8.3
-11.7
116.8
114.2
-11.4
ARG-101
SER-102
1.9
2.1
10.6
9.9
41.8
45.1
72.8
SER-102
ARG-103
1.7
1.9
-13.4
10.5
89.4
99.3
-14.9
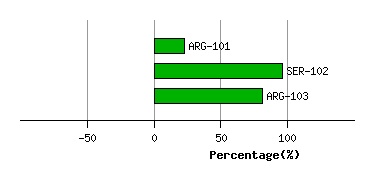
Graph shows rotational transition at bending residues and can be used
to identify hinge bending residues.
Probably only informative for interdomain rotations greater than 20 degrees
Residue
iResidue
i+1Distance of hinge axis to residue i in
(A) Distance of hinge axis to residue i in
(A) Change in
(deg) Change in
(deg) Angle of psi(i) axis to hinge axis
(deg) Angle of psi(i) axis to hinge axis
(deg) Percentage Progress
LEU-224
VAL-225
2.1
2.3
28.3
-17.8
30.1
24.7
38.4
VAL-225
THR-226
0.8
0.4
11.8
-24.9
101.4
104.0
20.1
THR-226
TYR-227
4.2
4.2
38.4
-28.9
52.4
42.2
28.4
TYR-227
SER-228
7.0
7.2
-21.5
34.3
108.7
109.1
14.9

Graph shows rotational transition at bending residues and can be used
to identify hinge bending residues.
Probably only informative for interdomain rotations greater than 20 degrees
Residue
iResidue
i+1Distance of hinge axis to residue i in
(A) Distance of hinge axis to residue i in
(A) Change in
(deg) Change in
(deg) Angle of psi(i) axis to hinge axis
(deg) Angle of psi(i) axis to hinge axis
(deg) Percentage Progress
ASN-268
PRO-269
14.1
14.3
5.1
9.6
105.0
99.8
-29.2
PRO-269
HIS-270
15.0
15.8
-12.1
10.0
26.8
24.0
13.9
HIS-270
VAL-271
16.7
17.2
-14.0
-6.2
43.1
49.0
54.2
VAL-271
VAL-272
13.3
13.7
4.8
-20.2
95.3
77.0
28.1
VAL-272
SER-273
11.4
11.4
16.0
-3.7
111.7
131.1
-31.2
SER-273
THR-274
7.6
7.8
-4.3
-14.0
30.8
49.0
62.0
THR-274
PHE-275
6.1
7.6
14.2
17.6
75.0
90.1
58.3
PHE-275
ASN-276
4.7
4.8
-130.9
121.1
122.0
119.7
-35.1
ASN-276
LEU-277
7.8
7.8
-39.2
53.8
170.5
156.4
58.9
LEU-277
GLU-278
7.3
6.1
7.3
24.3
67.3
50.7
58.1
GLU-278
PRO-279
10.2
8.2
-34.3
-0.2
118.0
122.5
-52.5
PRO-279
ILE-280
11.0
9.9
-12.7
0.0
143.5
155.9
-27.9
ILE-280
ALA-281
8.4
7.9
-12.6
11.4
152.2
145.2
-14.0
ALA-281
LYS-282
10.9
10.7
-19.0
10.1
97.1
95.6
5.8

Graph shows rotational transition at bending residues and can be used
to identify hinge bending residues.
Probably only informative for interdomain rotations greater than 20 degrees