Putative Enzyme Ydif
(All numbering and residues are taken from first PDB file)
![]()
![]()
Bending Residue Dihedral Analysis
Residue
iResidue
i+1Distance of hinge axis to residue i in
(A) Distance of hinge axis to residue i in
(A) Change in
(deg) Change in
(deg) Angle of psi(i) axis to hinge axis
(deg) Angle of psi(i) axis to hinge axis
(deg) Percentage Progress
LEU-275
ASP-276
13.9
13.7
-2.2
7.2
103.7
107.5
-17.4
PRO-284
LEU-285
23.7
24.1
30.3
-0.1
148.0
139.6
-671.0

Graph shows rotational transition at bending residues and can be used
to identify hinge bending residues.
Probably only informative for interdomain rotations greater than 20 degrees
Residue
iResidue
i+1Distance of hinge axis to residue i in
(A) Distance of hinge axis to residue i in
(A) Change in
(deg) Change in
(deg) Angle of psi(i) axis to hinge axis
(deg) Angle of psi(i) axis to hinge axis
(deg) Percentage Progress
VAL-304
GLY-305
2.8
3.0
-2.8
-2.8
142.0
143.4
-237.8
GLY-305
ASN-306
2.4
2.2
-11.6
-24.8
86.9
94.1
-117.6
ASN-306
VAL-307
6.0
5.6
-4.8
-52.9
80.2
115.6
-422.9
VAL-307
GLY-308
8.7
8.0
-3.0
3.9
152.8
109.5
-158.4
GLY-308
VAL-309
10.2
10.9
19.8
31.5
91.4
97.3
-158.9
VAL-309
GLY-310
13.7
14.4
20.9
30.8
50.9
44.5
987.9
GLY-310
ILE-311
15.5
15.2
-20.2
5.9
69.7
64.1
202.7
ILE-311
ALA-312
15.2
15.7
-7.9
-17.0
56.2
44.5
464.3
ALA-312
ASP-313
11.8
12.7
16.3
-13.5
162.8
146.9
-29.6
ASP-313
GLY-314
13.1
12.9
15.3
-15.0
135.8
155.6
-134.3
GLY-314
ILE-315
14.0
14.0
17.2
2.6
109.9
104.1
-276.3
ILE-315
GLY-316
10.6
11.0
8.4
-2.3
166.1
161.4
-144.2
GLY-316
LEU-317
9.8
10.0
5.4
-5.4
125.2
129.5
-32.0
LEU-317
VAL-318
13.3
13.3
4.3
-2.1
86.4
84.0
-12.8
VAL-318
ALA-319
13.5
13.7
0.9
-0.6
120.6
117.0
-48.4
ALA-319
ARG-320
10.4
10.5
2.7
-2.8
167.3
170.5
-24.0
ARG-320
GLU-321
11.4
11.4
3.7
-3.7
103.9
104.4
79.8

Graph shows rotational transition at bending residues and can be used
to identify hinge bending residues.
Probably only informative for interdomain rotations greater than 20 degrees
Residue
iResidue
i+1Distance of hinge axis to residue i in
(A) Distance of hinge axis to residue i in
(A) Change in
(deg) Change in
(deg) Angle of psi(i) axis to hinge axis
(deg) Angle of psi(i) axis to hinge axis
(deg) Percentage Progress
ILE-329
LEU-330
1.8
1.9
-2.4
1.6
32.8
33.1
21.9
LEU-330
THR-331
4.7
4.7
3.6
-9.3
82.5
82.9
28.6
THR-331
VAL-332
7.6
7.6
16.6
-26.4
123.3
130.9
133.1
VAL-332
GLU-333
11.0
10.9
5.1
-14.3
121.6
112.3
-109.5
GLU-333
THR-334
12.6
12.7
11.8
2.6
70.4
69.4
111.6
THR-334
GLY-335
16.0
16.0
-4.5
-3.3
143.9
149.4
-191.1
GLY-335
PRO-336
14.8
14.8
6.7
-3.3
39.5
39.6
102.0
PRO-336
ILE-337
12.9
12.8
-10.3
13.3
77.4
81.9
-108.6

Graph shows rotational transition at bending residues and can be used
to identify hinge bending residues.
Probably only informative for interdomain rotations greater than 20 degrees
Residue
iResidue
i+1Distance of hinge axis to residue i in
(A) Distance of hinge axis to residue i in
(A) Change in
(deg) Change in
(deg) Angle of psi(i) axis to hinge axis
(deg) Angle of psi(i) axis to hinge axis
(deg) Percentage Progress
LEU-371
ASP-372
5.1
5.3
-2.8
6.5
70.5
70.6
50.4
ASP-372
VAL-373
4.0
4.0
4.4
-19.5
118.9
122.7
265.4
VAL-373
CYS-374
0.6
0.6
9.3
-10.5
98.0
90.7
296.4

Graph shows rotational transition at bending residues and can be used
to identify hinge bending residues.
Probably only informative for interdomain rotations greater than 20 degrees
Residue
iResidue
i+1Distance of hinge axis to residue i in
(A) Distance of hinge axis to residue i in
(A) Change in
(deg) Change in
(deg) Angle of psi(i) axis to hinge axis
(deg) Angle of psi(i) axis to hinge axis
(deg) Percentage Progress
TYR-375
LEU-376
5.8
6.1
-5.5
9.0
115.4
114.0
158.9
LEU-376
SER-377
8.3
8.4
-5.8
2.6
118.4
122.1
-30.8
SER-377
PHE-378
11.4
11.6
-14.9
12.9
165.5
162.0
-26.7

Graph shows rotational transition at bending residues and can be used
to identify hinge bending residues.
Probably only informative for interdomain rotations greater than 20 degrees
Residue
iResidue
i+1Distance of hinge axis to residue i in
(A) Distance of hinge axis to residue i in
(A) Change in
(deg) Change in
(deg) Angle of psi(i) axis to hinge axis
(deg) Angle of psi(i) axis to hinge axis
(deg) Percentage Progress
GLU-380
VAL-381
12.9
12.9
-1.3
3.7
90.1
88.3
40.6
VAL-381
ASP-382
9.8
9.7
6.2
-3.6
164.8
163.8
-150.0
ASP-382
GLN-383
8.5
8.4
-2.3
6.4
84.2
83.2
180.8
GLN-383
HIS-384
7.2
7.2
3.8
-6.3
103.3
102.7
85.5
GLN-383
HIS-384
7.2
7.2
3.8
-6.3
103.3
102.7
85.5

Graph shows rotational transition at bending residues and can be used
to identify hinge bending residues.
Probably only informative for interdomain rotations greater than 20 degrees
Residue
iResidue
i+1Distance of hinge axis to residue i in
(A) Distance of hinge axis to residue i in
(A) Change in
(deg) Change in
(deg) Angle of psi(i) axis to hinge axis
(deg) Angle of psi(i) axis to hinge axis
(deg) Percentage Progress
GLN-383
HIS-384
7.2
7.2
3.8
-6.3
103.3
102.7
85.5
GLN-383
HIS-384
7.2
7.2
3.8
-6.3
103.3
102.7
85.5
HIS-384
GLY-385
3.5
3.4
3.2
0.5
175.3
172.4
-176.0
GLY-385
ASN-386
4.5
4.2
-7.8
-2.7
70.8
71.2
226.4

Graph shows rotational transition at bending residues and can be used
to identify hinge bending residues.
Probably only informative for interdomain rotations greater than 20 degrees
Residue
iResidue
i+1Distance of hinge axis to residue i in
(A) Distance of hinge axis to residue i in
(A) Change in
(deg) Change in
(deg) Angle of psi(i) axis to hinge axis
(deg) Angle of psi(i) axis to hinge axis
(deg) Percentage Progress
ILE-413
PHE-414
4.7
4.9
-2.0
2.7
78.0
74.9
61.4
PHE-414
CYS-415
7.4
7.4
-4.9
0.8
106.7
106.0
-11.8
CYS-415
GLY-416
10.8
10.9
-7.8
10.8
66.4
68.4
-52.7
GLY-416
THR-417
14.2
14.2
18.8
-13.5
107.6
106.4
-59.1
THR-417
LEU-418
17.4
17.2
3.3
-5.7
167.7
162.7
111.4
LEU-418
THR-419
17.3
17.3
0.1
-4.0
130.0
130.1
96.8

Graph shows rotational transition at bending residues and can be used
to identify hinge bending residues.
Probably only informative for interdomain rotations greater than 20 degrees
Residue
iResidue
i+1Distance of hinge axis to residue i in
(A) Distance of hinge axis to residue i in
(A) Change in
(deg) Change in
(deg) Angle of psi(i) axis to hinge axis
(deg) Angle of psi(i) axis to hinge axis
(deg) Percentage Progress
ARG-445
GLU-446
10.7
10.7
-5.3
-9.0
86.5
80.7
-6.5
GLU-446
LEU-447
9.4
9.5
16.1
-11.8
121.8
118.7
-21.2
LEU-447
PRO-448
10.8
11.0
15.2
-12.4
54.3
52.9
106.5

Graph shows rotational transition at bending residues and can be used
to identify hinge bending residues.
Probably only informative for interdomain rotations greater than 20 degrees
Residue
iResidue
i+1Distance of hinge axis to residue i in
(A) Distance of hinge axis to residue i in
(A) Change in
(deg) Change in
(deg) Angle of psi(i) axis to hinge axis
(deg) Angle of psi(i) axis to hinge axis
(deg) Percentage Progress
LEU-462
ASP-463
5.5
5.5
-9.7
7.1
86.9
83.1
4.0
ASP-463
VAL-464
5.2
5.3
-2.3
2.1
88.2
88.3
45.6
VAL-464
ARG-465
3.8
3.6
2.5
-5.7
88.5
90.5
67.1
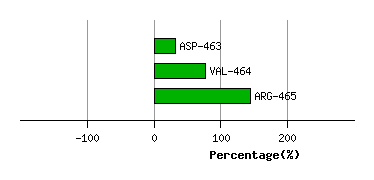
Graph shows rotational transition at bending residues and can be used
to identify hinge bending residues.
Probably only informative for interdomain rotations greater than 20 degrees
Residue
iResidue
i+1Distance of hinge axis to residue i in
(A) Distance of hinge axis to residue i in
(A) Change in
(deg) Change in
(deg) Angle of psi(i) axis to hinge axis
(deg) Angle of psi(i) axis to hinge axis
(deg) Percentage Progress
GLY-523
PHE-524
18.7
18.6
-0.5
-15.8
123.7
124.0
-222.7
PHE-524
VAL-525
15.9
15.8
-4.2
2.9
56.7
61.0
142.4
VAL-525
LEU-526
14.6
14.2
1.2
8.3
53.0
46.2
247.0
LEU-526
PRO-527
11.3
11.1
5.3
1.0
80.0
82.4
-165.9
PRO-527
GLU-528
12.1
12.4
-1.8
-0.6
61.5
61.2
45.0

Graph shows rotational transition at bending residues and can be used
to identify hinge bending residues.
Probably only informative for interdomain rotations greater than 20 degrees