Endo-1,4-Beta-Xylanase A
(All numbering and residues are taken from first PDB file)
![]()
![]()
Bending Residue Dihedral Analysis
Residue
iResidue
i+1Distance of hinge axis to residue i in
(A) Distance of hinge axis to residue i in
(A) Change in
(deg) Change in
(deg) Angle of psi(i) axis to hinge axis
(deg) Angle of psi(i) axis to hinge axis
(deg) Percentage Progress
ASN-8
TRP-9
3.4
3.5
-6.3
-6.3
41.2
39.3
145.3
TRP-9
THR-10
6.7
6.8
-3.4
0.6
94.3
95.3
30.8
THR-10
ASP-11
9.4
9.4
-2.6
1.9
39.3
33.8
-8.0

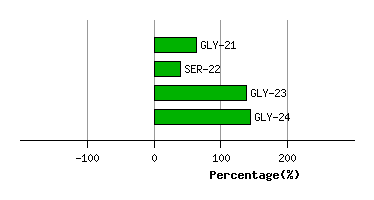
Graph shows rotational transition at bending residues and can be used
to identify hinge bending residues.
Probably only informative for interdomain rotations greater than 20 degrees
Residue
iResidue
i+1Distance of hinge axis to residue i in
(A) Distance of hinge axis to residue i in
(A) Change in
(deg) Change in
(deg) Angle of psi(i) axis to hinge axis
(deg) Angle of psi(i) axis to hinge axis
(deg) Percentage Progress
ASN-20
GLY-21
4.6
4.5
-5.6
1.9
64.6
59.5
93.0
GLY-21
SER-22
7.2
6.9
0.3
0.0
104.2
100.7
-23.4
SER-22
GLY-23
9.6
9.2
-0.6
-6.3
52.6
58.2
98.6
GLY-23
GLY-24
9.3
8.9
1.2
2.8
82.4
87.8
6.2
Graph shows rotational transition at bending residues and can be used
to identify hinge bending residues.
Probably only informative for interdomain rotations greater than 20 degrees
Residue
iResidue
i+1Distance of hinge axis to residue i in
(A) Distance of hinge axis to residue i in
(A) Change in
(deg) Change in
(deg) Angle of psi(i) axis to hinge axis
(deg) Angle of psi(i) axis to hinge axis
(deg) Percentage Progress
ASN-29
TRP-30
11.4
11.4
-1.8
0.9
37.8
40.3
47.1
TRP-30
SER-31
12.9
12.9
-0.1
5.8
90.2
90.2
-111.7
SER-31
ASN-32
16.4
16.4
-14.2
-4.7
44.2
52.8
269.3

Graph shows rotational transition at bending residues and can be used
to identify hinge bending residues.
Probably only informative for interdomain rotations greater than 20 degrees
Residue
iResidue
i+1Distance of hinge axis to residue i in
(A) Distance of hinge axis to residue i in
(A) Change in
(deg) Change in
(deg) Angle of psi(i) axis to hinge axis
(deg) Angle of psi(i) axis to hinge axis
(deg) Percentage Progress
PHE-36
VAL-37
11.0
11.0
-2.6
-0.4
37.7
37.8
11.0
VAL-37
VAL-38
8.9
8.8
2.9
-6.8
86.8
85.1
21.2
VAL-38
GLY-39
5.2
5.2
-7.3
-2.1
35.7
30.4
130.2

Graph shows rotational transition at bending residues and can be used
to identify hinge bending residues.
Probably only informative for interdomain rotations greater than 20 degrees
Residue
iResidue
i+1Distance of hinge axis to residue i in
(A) Distance of hinge axis to residue i in
(A) Change in
(deg) Change in
(deg) Angle of psi(i) axis to hinge axis
(deg) Angle of psi(i) axis to hinge axis
(deg) Percentage Progress
VAL-57
TRP-58
9.0
9.1
0.0
-6.8
109.8
105.2
83.0
TRP-58
ALA-59
10.0
10.1
4.7
-4.1
92.5
91.3
80.4
ALA-59
PRO-60
13.4
13.6
1.7
-1.5
144.7
143.2
38.6
PRO-60
ASN-61
14.9
14.9
16.2
-9.4
84.1
85.6
665.8

Graph shows rotational transition at bending residues and can be used
to identify hinge bending residues.
Probably only informative for interdomain rotations greater than 20 degrees
Residue
iResidue
i+1Distance of hinge axis to residue i in
(A) Distance of hinge axis to residue i in
(A) Change in
(deg) Change in
(deg) Angle of psi(i) axis to hinge axis
(deg) Angle of psi(i) axis to hinge axis
(deg) Percentage Progress
GLY-64
TYR-65
14.6
14.7
-28.1
-7.4
46.4
37.5
569.2
TYR-65
LEU-66
12.8
12.9
-1.7
10.0
78.0
81.8
-134.2
LEU-66
THR-67
9.7
9.7
0.2
1.4
103.6
103.1
2.3

Graph shows rotational transition at bending residues and can be used
to identify hinge bending residues.
Probably only informative for interdomain rotations greater than 20 degrees
Residue
iResidue
i+1Distance of hinge axis to residue i in
(A) Distance of hinge axis to residue i in
(A) Change in
(deg) Change in
(deg) Angle of psi(i) axis to hinge axis
(deg) Angle of psi(i) axis to hinge axis
(deg) Percentage Progress
MET-169
ALA-170
6.2
6.4
-2.0
-0.4
57.3
58.4
15.9
ALA-170
THR-171
6.6
6.7
3.2
6.1
70.8
72.8
157.6
THR-171
GLU-172
7.8
8.0
3.7
-16.5
143.0
143.1
199.4
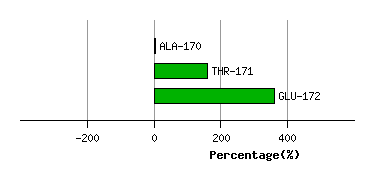
Graph shows rotational transition at bending residues and can be used
to identify hinge bending residues.
Probably only informative for interdomain rotations greater than 20 degrees
Residue
iResidue
i+1Distance of hinge axis to residue i in
(A) Distance of hinge axis to residue i in
(A) Change in
(deg) Change in
(deg) Angle of psi(i) axis to hinge axis
(deg) Angle of psi(i) axis to hinge axis
(deg) Percentage Progress
SER-177
GLY-178
16.8
16.7
-10.2
-5.3
28.2
29.5
253.0
GLY-178
SER-179
14.7
14.7
9.0
6.9
87.1
84.5
-94.4
SER-179
SER-180
11.8
11.9
-5.3
0.4
49.1
52.7
67.3

Graph shows rotational transition at bending residues and can be used
to identify hinge bending residues.
Probably only informative for interdomain rotations greater than 20 degrees