Sialidase
(All numbering and residues are taken from first PDB file)
![]()
![]()
Bending Residue Dihedral Analysis
Residue
iResidue
i+1Distance of hinge axis to residue i in
(A) Distance of hinge axis to residue i in
(A) Change in
(deg) Change in
(deg) Angle of psi(i) axis to hinge axis
(deg) Angle of psi(i) axis to hinge axis
(deg) Percentage Progress
ILE-218
PHE-219
6.1
6.1
4.0
-10.8
176.5
173.7
95.2
PHE-219
ARG-220
5.1
5.4
-3.3
4.8
77.0
74.3
59.7
ARG-220
GLY-221
7.1
7.3
-2.9
-4.9
34.6
35.1
80.6

Graph shows rotational transition at bending residues and can be used
to identify hinge bending residues.
Probably only informative for interdomain rotations greater than 20 degrees
Residue
iResidue
i+1Distance of hinge axis to residue i in
(A) Distance of hinge axis to residue i in
(A) Change in
(deg) Change in
(deg) Angle of psi(i) axis to hinge axis
(deg) Angle of psi(i) axis to hinge axis
(deg) Percentage Progress
ALA-240
PHE-241
6.7
6.9
8.5
-5.7
9.2
6.6
16.2
PHE-241
ALA-242
6.1
6.2
-0.8
0.5
112.2
112.0
94.0
ALA-242
GLU-243
3.3
3.4
-10.1
6.0
167.0
167.3
-60.8
GLU-243
LYS-244
2.5
2.8
4.3
-8.9
74.4
76.2
52.9
LYS-244
ARG-245
3.9
4.0
-5.2
2.7
145.7
150.9
-48.2
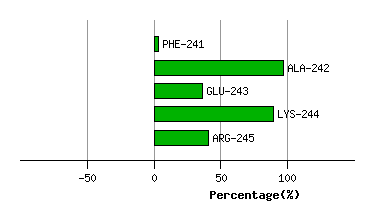
Graph shows rotational transition at bending residues and can be used
to identify hinge bending residues.
Probably only informative for interdomain rotations greater than 20 degrees
Residue
iResidue
i+1Distance of hinge axis to residue i in
(A) Distance of hinge axis to residue i in
(A) Change in
(deg) Change in
(deg) Angle of psi(i) axis to hinge axis
(deg) Angle of psi(i) axis to hinge axis
(deg) Percentage Progress
ASP-259
ILE-260
5.9
6.5
-3.7
6.4
18.4
16.6
-43.7
ILE-260
ILE-261
7.1
7.5
-11.8
13.6
56.3
57.8
-31.5
ILE-261
THR-262
7.6
7.9
0.6
-5.3
159.6
160.2
225.5
THR-262
ARG-263
8.9
9.1
-4.0
9.1
55.0
55.0
-158.2
ARG-263
THR-264
9.6
9.9
8.2
-3.1
144.6
144.6
-52.2
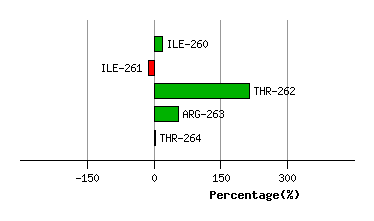
Graph shows rotational transition at bending residues and can be used
to identify hinge bending residues.
Probably only informative for interdomain rotations greater than 20 degrees
Residue
iResidue
i+1Distance of hinge axis to residue i in
(A) Distance of hinge axis to residue i in
(A) Change in
(deg) Change in
(deg) Angle of psi(i) axis to hinge axis
(deg) Angle of psi(i) axis to hinge axis
(deg) Percentage Progress
TRP-272
ASP-273
11.2
11.4
10.3
-16.3
49.2
53.7
-14.5
ASP-273
THR-274
13.9
14.1
5.3
4.6
31.8
26.4
136.2
THR-274
GLU-275
14.0
14.4
-13.8
1.9
120.0
121.4
-188.7
GLU-275
LEU-276
11.0
11.4
2.3
-2.8
131.7
134.5
-131.6
GLU-275
LEU-276
11.0
11.4
2.3
-2.8
131.7
134.5
-131.6

Graph shows rotational transition at bending residues and can be used
to identify hinge bending residues.
Probably only informative for interdomain rotations greater than 20 degrees
Residue
iResidue
i+1Distance of hinge axis to residue i in
(A) Distance of hinge axis to residue i in
(A) Change in
(deg) Change in
(deg) Angle of psi(i) axis to hinge axis
(deg) Angle of psi(i) axis to hinge axis
(deg) Percentage Progress
GLU-275
LEU-276
11.0
11.4
2.3
-2.8
131.7
134.5
-131.6
GLU-275
LEU-276
11.0
11.4
2.3
-2.8
131.7
134.5
-131.6
LEU-276
ASN-277
12.2
12.6
7.5
-5.6
133.2
134.2
7.8
ASN-277
LEU-278
10.9
11.4
11.3
-14.2
105.4
101.1
15.0
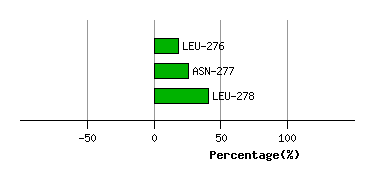
Graph shows rotational transition at bending residues and can be used
to identify hinge bending residues.
Probably only informative for interdomain rotations greater than 20 degrees
Residue
iResidue
i+1Distance of hinge axis to residue i in
(A) Distance of hinge axis to residue i in
(A) Change in
(deg) Change in
(deg) Angle of psi(i) axis to hinge axis
(deg) Angle of psi(i) axis to hinge axis
(deg) Percentage Progress
HIS-695
PHE-696
18.2
18.1
-3.4
5.2
109.3
108.3
38.6
PHE-696
LEU-697
17.8
17.7
-5.1
6.2
154.0
155.6
52.3
LEU-697
LEU-698
16.6
16.8
5.0
-13.0
89.4
86.7
-85.8
LEU-698
PHE-699
13.6
13.8
5.2
-3.7
159.3
163.7
-78.4
LEU-698
PHE-699
13.6
13.8
5.2
-3.7
159.3
163.7
-78.4

Graph shows rotational transition at bending residues and can be used
to identify hinge bending residues.
Probably only informative for interdomain rotations greater than 20 degrees
Residue
iResidue
i+1Distance of hinge axis to residue i in
(A) Distance of hinge axis to residue i in
(A) Change in
(deg) Change in
(deg) Angle of psi(i) axis to hinge axis
(deg) Angle of psi(i) axis to hinge axis
(deg) Percentage Progress
LEU-698
PHE-699
13.6
13.8
5.2
-3.7
159.3
163.7
-78.4
LEU-698
PHE-699
13.6
13.8
5.2
-3.7
159.3
163.7
-78.4
PHE-699
THR-700
14.1
14.0
9.3
-5.6
101.3
97.5
56.8
THR-700
ASN-701
12.0
11.9
-4.7
8.0
32.4
30.3
-2.2
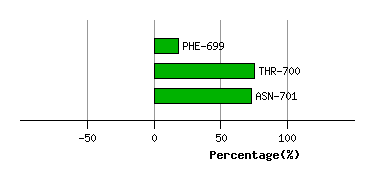
Graph shows rotational transition at bending residues and can be used
to identify hinge bending residues.
Probably only informative for interdomain rotations greater than 20 degrees
Residue
iResidue
i+1Distance of hinge axis to residue i in
(A) Distance of hinge axis to residue i in
(A) Change in
(deg) Change in
(deg) Angle of psi(i) axis to hinge axis
(deg) Angle of psi(i) axis to hinge axis
(deg) Percentage Progress
ILE-743
TYR-744
8.0
7.8
-1.4
6.6
77.6
78.1
73.4
TYR-744
GLN-745
9.4
9.2
10.2
-11.6
154.0
159.7
-2.1
GLN-745
LEU-746
10.0
10.0
6.4
-9.3
90.0
91.3
-57.8

Graph shows rotational transition at bending residues and can be used
to identify hinge bending residues.
Probably only informative for interdomain rotations greater than 20 degrees
Residue
iResidue
i+1Distance of hinge axis to residue i in
(A) Distance of hinge axis to residue i in
(A) Change in
(deg) Change in
(deg) Angle of psi(i) axis to hinge axis
(deg) Angle of psi(i) axis to hinge axis
(deg) Percentage Progress
ASP-747
SER-748
10.4
10.3
7.6
-22.2
50.4
54.3
-236.1
SER-748
GLU-749
11.3
11.1
8.6
3.9
73.4
74.6
68.4
GLU-749
ASN-750
7.9
7.6
-1.2
-11.0
40.6
43.4
73.8
ASN-750
ALA-751
6.2
5.8
2.0
1.0
153.8
155.7
41.2
ALA-751
ILE-752
6.4
6.2
24.8
-23.3
120.5
124.6
-41.0
ALA-751
ILE-752
6.4
6.2
24.8
-23.3
120.5
124.6
-41.0

Graph shows rotational transition at bending residues and can be used
to identify hinge bending residues.
Probably only informative for interdomain rotations greater than 20 degrees
Residue
iResidue
i+1Distance of hinge axis to residue i in
(A) Distance of hinge axis to residue i in
(A) Change in
(deg) Change in
(deg) Angle of psi(i) axis to hinge axis
(deg) Angle of psi(i) axis to hinge axis
(deg) Percentage Progress
ALA-751
ILE-752
6.4
6.2
24.8
-23.3
120.5
124.6
-41.0
ALA-751
ILE-752
6.4
6.2
24.8
-23.3
120.5
124.6
-41.0
ILE-752
VAL-753
4.0
4.0
-9.3
8.1
45.8
40.3
-2.3
VAL-753
ILE-754
3.5
3.6
-2.8
14.4
42.5
46.4
-71.6

Graph shows rotational transition at bending residues and can be used
to identify hinge bending residues.
Probably only informative for interdomain rotations greater than 20 degrees
Residue
iResidue
i+1Distance of hinge axis to residue i in
(A) Distance of hinge axis to residue i in
(A) Change in
(deg) Change in
(deg) Angle of psi(i) axis to hinge axis
(deg) Angle of psi(i) axis to hinge axis
(deg) Percentage Progress
MET-762
ARG-763
3.9
3.9
9.6
-11.4
150.4
148.7
42.4
ARG-763
ILE-764
4.3
4.2
-2.4
2.4
54.9
52.2
83.2
ILE-764
LEU-765
2.1
2.1
-1.9
1.2
26.5
28.5
-82.6

Graph shows rotational transition at bending residues and can be used
to identify hinge bending residues.
Probably only informative for interdomain rotations greater than 20 degrees
Residue
iResidue
i+1Distance of hinge axis to residue i in
(A) Distance of hinge axis to residue i in
(A) Change in
(deg) Change in
(deg) Angle of psi(i) axis to hinge axis
(deg) Angle of psi(i) axis to hinge axis
(deg) Percentage Progress
ARG-766
MET-767
0.4
0.4
21.0
-18.3
42.6
38.8
101.8
MET-767
PRO-768
3.4
3.2
-2.4
12.4
137.2
139.8
132.3
PRO-768
ILE-769
4.2
3.9
-4.1
8.8
97.4
94.7
-39.5
ILE-769
THR-770
8.0
7.6
-10.0
-3.7
154.6
153.0
-216.4

Graph shows rotational transition at bending residues and can be used
to identify hinge bending residues.
Probably only informative for interdomain rotations greater than 20 degrees