Unconventional Myosin-Ib
(All numbering and residues are taken from first PDB file)
![]()
![]()
Bending Residue Dihedral Analysis
Residue
iResidue
i+1Distance of hinge axis to residue i in
(A) Distance of hinge axis to residue i in
(A) Change in
(deg) Change in
(deg) Angle of psi(i) axis to hinge axis
(deg) Angle of psi(i) axis to hinge axis
(deg) Percentage Progress
LYS-7
SER-8
22.2
27.0
-172.1
-33.9
74.2
137.9
-289.0
SER-8
SER-9
19.8
24.5
33.8
-17.7
177.1
107.6
-52.7
SER-9
LEU-10
20.7
21.2
19.4
4.1
114.7
33.0
33.4
LEU-10
LEU-11
19.7
18.5
-1.8
8.6
55.8
93.4
-25.5
LEU-11
ASP-12
23.1
20.0
29.3
37.8
62.8
50.7
195.8
ASP-12
ASN-13
25.4
23.0
3.3
-2.5
41.7
22.7
10.5
ASN-13
MET-14
24.3
22.6
-29.4
-28.2
82.4
95.2
-28.2

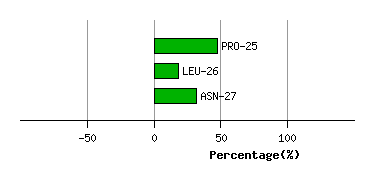
Graph shows rotational transition at bending residues and can be used
to identify hinge bending residues.
Probably only informative for interdomain rotations greater than 20 degrees
Residue
iResidue
i+1Distance of hinge axis to residue i in
(A) Distance of hinge axis to residue i in
(A) Change in
(deg) Change in
(deg) Angle of psi(i) axis to hinge axis
(deg) Angle of psi(i) axis to hinge axis
(deg) Percentage Progress
GLU-24
PRO-25
18.2
17.6
-6.6
-10.1
52.0
49.5
16.3
PRO-25
LEU-26
19.6
18.4
21.0
14.9
109.9
111.5
-28.8
LEU-26
ASN-27
16.4
15.2
-13.1
0.2
82.9
69.1
13.3
Graph shows rotational transition at bending residues and can be used
to identify hinge bending residues.
Probably only informative for interdomain rotations greater than 20 degrees
Residue
iResidue
i+1Distance of hinge axis to residue i in
(A) Distance of hinge axis to residue i in
(A) Change in
(deg) Change in
(deg) Angle of psi(i) axis to hinge axis
(deg) Angle of psi(i) axis to hinge axis
(deg) Percentage Progress
GLU-29
THR-30
17.4
17.0
-3.6
8.1
92.8
93.5
15.7
THR-30
PHE-31
17.0
16.6
-27.3
23.3
93.8
108.3
-27.4
PHE-31
ILE-32
13.2
12.8
6.1
5.4
20.5
13.4
61.1

Graph shows rotational transition at bending residues and can be used
to identify hinge bending residues.
Probably only informative for interdomain rotations greater than 20 degrees
Residue
iResidue
i+1Distance of hinge axis to residue i in
(A) Distance of hinge axis to residue i in
(A) Change in
(deg) Change in
(deg) Angle of psi(i) axis to hinge axis
(deg) Angle of psi(i) axis to hinge axis
(deg) Percentage Progress
GLU-43
ILE-44
11.1
12.5
12.8
-25.6
63.6
76.7
8.8
ILE-44
TYR-45
7.4
8.8
37.1
-36.2
18.0
30.2
-4.0
TYR-45
THR-46
7.5
8.7
-0.4
-4.3
129.6
137.4
-27.2
THR-46
TYR-47
8.1
8.7
10.7
-10.9
23.1
36.1
-13.2

Graph shows rotational transition at bending residues and can be used
to identify hinge bending residues.
Probably only informative for interdomain rotations greater than 20 degrees
Residue
iResidue
i+1Distance of hinge axis to residue i in
(A) Distance of hinge axis to residue i in
(A) Change in
(deg) Change in
(deg) Angle of psi(i) axis to hinge axis
(deg) Angle of psi(i) axis to hinge axis
(deg) Percentage Progress
SER-60
LEU-61
8.2
10.8
13.8
-10.9
69.4
70.5
54.7
LEU-61
PRO-62
9.8
12.5
18.0
-7.3
83.4
78.5
26.8
PRO-62
ILE-63
13.4
16.3
19.7
3.5
28.8
15.8
71.8

Graph shows rotational transition at bending residues and can be used
to identify hinge bending residues.
Probably only informative for interdomain rotations greater than 20 degrees
Residue
iResidue
i+1Distance of hinge axis to residue i in
(A) Distance of hinge axis to residue i in
(A) Change in
(deg) Change in
(deg) Angle of psi(i) axis to hinge axis
(deg) Angle of psi(i) axis to hinge axis
(deg) Percentage Progress
ASP-71
TYR-72
22.4
23.3
-7.4
12.7
32.9
48.7
-13.2
TYR-72
ARG-73
19.7
20.0
-16.7
-9.8
44.8
45.4
81.6
ARG-73
ASN-74
21.8
22.0
7.1
7.0
144.1
146.6
22.2
ASN-74
ARG-75
22.0
22.6
-41.8
45.7
93.0
73.4
-26.5
ARG-75
ASN-76
20.2
21.6
35.8
4.5
122.3
125.6
-74.7

Graph shows rotational transition at bending residues and can be used
to identify hinge bending residues.
Probably only informative for interdomain rotations greater than 20 degrees
Residue
iResidue
i+1Distance of hinge axis to residue i in
(A) Distance of hinge axis to residue i in
(A) Change in
(deg) Change in
(deg) Angle of psi(i) axis to hinge axis
(deg) Angle of psi(i) axis to hinge axis
(deg) Percentage Progress
GLU-79
LEU-80
20.1
19.9
34.1
-45.3
13.7
11.7
-43.7
LEU-80
SER-81
18.4
18.8
-26.7
15.4
101.6
111.4
79.8
SER-81
PRO-82
15.9
16.7
-10.2
5.0
71.6
94.1
8.9

Graph shows rotational transition at bending residues and can be used
to identify hinge bending residues.
Probably only informative for interdomain rotations greater than 20 degrees
Residue
iResidue
i+1Distance of hinge axis to residue i in
(A) Distance of hinge axis to residue i in
(A) Change in
(deg) Change in
(deg) Angle of psi(i) axis to hinge axis
(deg) Angle of psi(i) axis to hinge axis
(deg) Percentage Progress
PHE-85
ALA-86
14.0
14.5
-16.1
20.3
153.8
163.8
23.0
ALA-86
LEU-87
14.3
14.7
5.7
3.2
45.4
51.4
27.7
LEU-87
SER-88
11.6
12.2
-5.7
-2.7
87.6
90.8
-14.3
SER-88
ASP-89
13.7
14.8
3.4
5.1
112.8
116.1
-17.6
SER-88
ASP-89
13.7
14.8
3.4
5.1
112.8
116.1
-17.6

Graph shows rotational transition at bending residues and can be used
to identify hinge bending residues.
Probably only informative for interdomain rotations greater than 20 degrees
Residue
iResidue
i+1Distance of hinge axis to residue i in
(A) Distance of hinge axis to residue i in
(A) Change in
(deg) Change in
(deg) Angle of psi(i) axis to hinge axis
(deg) Angle of psi(i) axis to hinge axis
(deg) Percentage Progress
SER-88
ASP-89
13.7
14.8
3.4
5.1
112.8
116.1
-17.6
SER-88
ASP-89
13.7
14.8
3.4
5.1
112.8
116.1
-17.6
ASP-89
GLU-90
16.7
17.5
8.0
-11.2
173.6
173.5
18.2
GLU-90
ALA-91
15.4
15.9
-12.6
17.8
68.4
79.1
30.7

Graph shows rotational transition at bending residues and can be used
to identify hinge bending residues.
Probably only informative for interdomain rotations greater than 20 degrees
Residue
iResidue
i+1Distance of hinge axis to residue i in
(A) Distance of hinge axis to residue i in
(A) Change in
(deg) Change in
(deg) Angle of psi(i) axis to hinge axis
(deg) Angle of psi(i) axis to hinge axis
(deg) Percentage Progress
ILE-106
THR-107
7.5
7.9
9.7
-7.1
100.7
94.0
-4.7
THR-107
GLY-108
6.7
6.7
-50.9
38.0
45.3
45.7
33.7
GLY-108
GLU-109
6.1
6.2
20.5
-44.7
131.7
129.9
105.2

Graph shows rotational transition at bending residues and can be used
to identify hinge bending residues.
Probably only informative for interdomain rotations greater than 20 degrees
Residue
iResidue
i+1Distance of hinge axis to residue i in
(A) Distance of hinge axis to residue i in
(A) Change in
(deg) Change in
(deg) Angle of psi(i) axis to hinge axis
(deg) Angle of psi(i) axis to hinge axis
(deg) Percentage Progress
VAL-125
ALA-126
19.0
20.4
14.5
2.0
73.6
56.2
19.0
ALA-126
ALA-127
22.0
22.6
-8.3
2.9
113.3
95.6
-14.3
ALA-127
VAL-128
22.3
23.4
-7.6
-4.6
43.1
35.7
-0.4

Graph shows rotational transition at bending residues and can be used
to identify hinge bending residues.
Probably only informative for interdomain rotations greater than 20 degrees
Residue
iResidue
i+1Distance of hinge axis to residue i in
(A) Distance of hinge axis to residue i in
(A) Change in
(deg) Change in
(deg) Angle of psi(i) axis to hinge axis
(deg) Angle of psi(i) axis to hinge axis
(deg) Percentage Progress
MET-170
ASP-171
18.7
19.5
-8.8
19.5
137.3
139.3
16.3
ASP-171
ILE-172
20.4
21.8
-31.0
17.8
65.3
60.7
53.7
ILE-172
GLU-173
22.1
22.4
-33.6
25.2
153.4
140.5
-32.5

Graph shows rotational transition at bending residues and can be used
to identify hinge bending residues.
Probably only informative for interdomain rotations greater than 20 degrees
Residue
iResidue
i+1Distance of hinge axis to residue i in
(A) Distance of hinge axis to residue i in
(A) Change in
(deg) Change in
(deg) Angle of psi(i) axis to hinge axis
(deg) Angle of psi(i) axis to hinge axis
(deg) Percentage Progress
ASP-179
PRO-180
30.5
30.3
21.5
2.7
71.3
68.3
42.7
PRO-180
LEU-181
28.5
28.5
21.5
-33.4
84.9
83.7
6.0
LEU-181
GLY-182
30.1
29.9
1.3
-4.5
38.5
47.6
-26.0

Graph shows rotational transition at bending residues and can be used
to identify hinge bending residues.
Probably only informative for interdomain rotations greater than 20 degrees
Residue
iResidue
i+1Distance of hinge axis to residue i in
(A) Distance of hinge axis to residue i in
(A) Change in
(deg) Change in
(deg) Angle of psi(i) axis to hinge axis
(deg) Angle of psi(i) axis to hinge axis
(deg) Percentage Progress
LYS-381
VAL-382
23.9
25.1
-7.0
-5.1
24.7
29.7
53.9
VAL-382
MET-383
21.5
22.6
3.9
0.9
100.3
92.9
-21.6
MET-383
GLY-384
18.6
19.3
-2.4
13.1
48.5
47.8
-36.7
GLY-384
VAL-385
16.8
17.9
4.8
1.3
118.6
114.9
-9.1

Graph shows rotational transition at bending residues and can be used
to identify hinge bending residues.
Probably only informative for interdomain rotations greater than 20 degrees
Residue
iResidue
i+1Distance of hinge axis to residue i in
(A) Distance of hinge axis to residue i in
(A) Change in
(deg) Change in
(deg) Angle of psi(i) axis to hinge axis
(deg) Angle of psi(i) axis to hinge axis
(deg) Percentage Progress
ILE-416
GLU-417
6.0
4.7
-14.4
17.7
143.1
156.4
14.2
GLU-417
LEU-418
8.1
6.0
18.6
-5.1
88.5
82.5
38.2
LEU-418
THR-419
8.3
5.5
36.3
8.2
86.3
92.2
57.8

Graph shows rotational transition at bending residues and can be used
to identify hinge bending residues.
Probably only informative for interdomain rotations greater than 20 degrees
Residue
iResidue
i+1Distance of hinge axis to residue i in
(A) Distance of hinge axis to residue i in
(A) Change in
(deg) Change in
(deg) Angle of psi(i) axis to hinge axis
(deg) Angle of psi(i) axis to hinge axis
(deg) Percentage Progress
ILE-432
GLU-433
10.0
10.6
-6.2
30.5
83.4
82.1
-9.8
GLU-433
TRP-434
8.3
9.2
67.6
25.3
59.1
32.8
238.7
TRP-434
THR-435
6.9
7.4
-158.2
-141.5
87.7
87.4
70.3
THR-435
HIS-436
4.1
9.7
73.8
-33.7
47.3
53.7
195.2
HIS-436
ILE-437
5.9
9.3
-6.6
-68.0
94.7
158.3
-344.2
ILE-437
ASP-438
8.7
9.5
-153.2
66.1
92.6
105.4
-2.6
ASP-438
TYR-439
8.6
11.5
-30.3
-5.3
152.2
152.2
-141.9
TYR-439
PHE-440
7.9
10.2
15.8
7.9
87.5
82.2
36.9

Graph shows rotational transition at bending residues and can be used
to identify hinge bending residues.
Probably only informative for interdomain rotations greater than 20 degrees
Residue
iResidue
i+1Distance of hinge axis to residue i in
(A) Distance of hinge axis to residue i in
(A) Change in
(deg) Change in
(deg) Angle of psi(i) axis to hinge axis
(deg) Angle of psi(i) axis to hinge axis
(deg) Percentage Progress
TYR-592
ILE-593
5.2
6.5
-6.0
-23.9
27.6
36.6
56.5
ILE-593
ARG-594
4.2
4.9
2.6
-4.3
96.7
105.9
19.4
ARG-594
CYS-595
1.5
2.1
21.1
0.9
164.0
154.0
-56.5
CYS-595
ILE-596
1.9
1.6
5.9
-1.0
113.9
108.2
9.8
ILE-596
LYS-597
3.3
2.4
2.4
12.4
177.6
172.4
-49.2

Graph shows rotational transition at bending residues and can be used
to identify hinge bending residues.
Probably only informative for interdomain rotations greater than 20 degrees
Residue
iResidue
i+1Distance of hinge axis to residue i in
(A) Distance of hinge axis to residue i in
(A) Change in
(deg) Change in
(deg) Angle of psi(i) axis to hinge axis
(deg) Angle of psi(i) axis to hinge axis
(deg) Percentage Progress
LEU-611
VAL-612
12.4
11.8
-3.8
7.5
132.4
135.5
21.6
VAL-612
CYS-613
10.0
9.5
2.9
7.0
27.0
25.3
35.2
CYS-613
HIS-614
12.8
12.2
-7.6
-15.4
113.5
106.6
-52.8

Graph shows rotational transition at bending residues and can be used
to identify hinge bending residues.
Probably only informative for interdomain rotations greater than 20 degrees
Residue
iResidue
i+1Distance of hinge axis to residue i in
(A) Distance of hinge axis to residue i in
(A) Change in
(deg) Change in
(deg) Angle of psi(i) axis to hinge axis
(deg) Angle of psi(i) axis to hinge axis
(deg) Percentage Progress
ARG-617
TYR-618
12.2
11.2
-7.4
38.9
69.6
83.5
-44.4
TYR-618
LEU-619
11.2
10.4
-35.0
5.3
80.3
55.2
37.5
LEU-619
GLY-620
7.5
7.0
-22.5
6.4
24.7
23.2
61.7

Graph shows rotational transition at bending residues and can be used
to identify hinge bending residues.
Probably only informative for interdomain rotations greater than 20 degrees
Residue
iResidue
i+1Distance of hinge axis to residue i in
(A) Distance of hinge axis to residue i in
(A) Change in
(deg) Change in
(deg) Angle of psi(i) axis to hinge axis
(deg) Angle of psi(i) axis to hinge axis
(deg) Percentage Progress
ARG-628
ARG-629
6.4
5.3
-17.4
12.7
107.5
113.4
-1.8
ARG-629
ALA-630
9.8
9.0
-37.1
31.3
173.2
175.0
56.9
ALA-630
GLY-631
8.3
8.3
10.7
27.2
56.0
50.0
114.9
GLY-631
TYR-632
10.2
10.5
-16.3
-4.0
52.4
69.9
43.7
TYR-632
ALA-633
10.8
12.5
-54.9
57.1
7.9
18.9
-108.0

Graph shows rotational transition at bending residues and can be used
to identify hinge bending residues.
Probably only informative for interdomain rotations greater than 20 degrees