Hypothetical Transcriptional Regulator In Qaca 5'Region
(All numbering and residues are taken from first PDB file)
![]()
![]()
Bending Residue Dihedral Analysis
Residue
iResidue
i+1Distance of hinge axis to residue i in
(A) Distance of hinge axis to residue i in
(A) Change in
(deg) Change in
(deg) Angle of psi(i) axis to hinge axis
(deg) Angle of psi(i) axis to hinge axis
(deg) Percentage Progress
GLU-58
SER-59
1.6
2.6
13.9
-1.5
20.4
26.2
33.9
SER-59
LYS-60
4.1
5.1
-0.1
-1.5
128.0
132.4
-1.6
LYS-60
TRP-61
4.2
3.9
-30.9
41.4
111.7
106.4
6.4
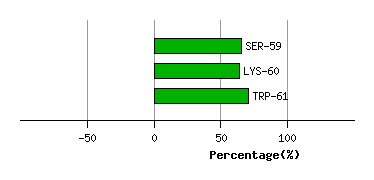
Graph shows rotational transition at bending residues and can be used
to identify hinge bending residues.
Probably only informative for interdomain rotations greater than 20 degrees
Residue
iResidue
i+1Distance of hinge axis to residue i in
(A) Distance of hinge axis to residue i in
(A) Change in
(deg) Change in
(deg) Angle of psi(i) axis to hinge axis
(deg) Angle of psi(i) axis to hinge axis
(deg) Percentage Progress
LEU-87
THR-88
13.3
12.8
-13.5
18.6
64.8
73.3
-3.1
THR-88
THR-89
12.5
12.8
-25.3
-6.4
101.2
107.2
-52.7
THR-89
GLU-90
9.0
9.8
167.4
46.2
47.7
7.5
513.2
GLU-90
TYR-91
9.3
10.0
-25.4
61.6
125.4
107.6
-861.1
TYR-91
TYR-92
5.8
13.6
-171.5
174.7
123.1
95.1
44.5
TYR-92
TYR-93
4.3
13.2
91.2
-35.9
70.7
79.1
139.9
TYR-93
PRO-94
7.5
10.0
153.6
-11.7
60.8
28.8
322.3
PRO-94
LEU-95
9.7
11.5
35.5
2.0
11.3
40.1
101.9

Graph shows rotational transition at bending residues and can be used
to identify hinge bending residues.
Probably only informative for interdomain rotations greater than 20 degrees
Residue
iResidue
i+1Distance of hinge axis to residue i in
(A) Distance of hinge axis to residue i in
(A) Change in
(deg) Change in
(deg) Angle of psi(i) axis to hinge axis
(deg) Angle of psi(i) axis to hinge axis
(deg) Percentage Progress
TYR-107
LYS-108
5.6
5.7
26.9
-10.0
125.6
148.7
-24.4
LYS-108
THR-109
6.7
6.2
-42.2
33.2
96.5
81.1
13.8
THR-109
ASN-110
6.9
6.1
54.6
-51.8
27.5
47.0
24.7
ASN-110
SER-111
9.8
9.3
2.4
6.6
39.8
57.3
29.1
SER-111
ILE-112
9.4
9.4
-15.2
6.0
127.9
151.3
-25.4
ILE-112
ASN-113
5.7
6.5
2.5
-11.4
64.4
60.1
-9.7
ASN-113
GLU-114
6.9
7.5
58.9
-22.3
27.1
55.9
77.3
GLU-114
LYS-115
9.5
10.6
-19.1
1.2
138.2
160.6
-47.1

Graph shows rotational transition at bending residues and can be used
to identify hinge bending residues.
Probably only informative for interdomain rotations greater than 20 degrees