Chromosome Segregation Smc Protein
(All numbering and residues are taken from first PDB file)
![]()
![]()
Bending Residue Dihedral Analysis
Residue
iResidue
i+1Distance of hinge axis to residue i in
(A) Distance of hinge axis to residue i in
(A) Change in
(deg) Change in
(deg) Angle of psi(i) axis to hinge axis
(deg) Angle of psi(i) axis to hinge axis
(deg) Percentage Progress
ASN-581
ARG-582
6.0
5.9
19.6
-28.7
79.0
90.0
-2.7
ARG-582
ILE-583
2.3
2.4
-8.6
-17.9
56.8
46.4
70.7
ILE-583
SER-584
3.5
3.1
29.4
-27.2
131.3
119.5
7.2
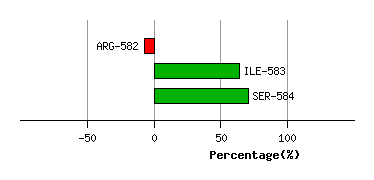
Graph shows rotational transition at bending residues and can be used
to identify hinge bending residues.
Probably only informative for interdomain rotations greater than 20 degrees
Residue
iResidue
i+1Distance of hinge axis to residue i in
(A) Distance of hinge axis to residue i in
(A) Change in
(deg) Change in
(deg) Angle of psi(i) axis to hinge axis
(deg) Angle of psi(i) axis to hinge axis
(deg) Percentage Progress
ALA-596
VAL-597
3.6
3.0
-2.6
3.0
96.0
90.2
10.0
VAL-597
ASP-598
5.7
5.4
-1.7
17.9
106.4
93.5
15.1
ASP-598
LEU-599
7.9
7.8
7.9
-11.6
133.6
148.6
24.7
LEU-599
VAL-600
8.6
8.3
18.3
-16.9
139.0
125.5
-11.8
VAL-600
LYS-601
9.3
9.4
15.0
-5.6
70.9
61.9
22.9
LYS-601
PHE-602
12.6
12.7
-3.5
-1.6
46.3
64.0
34.7

Graph shows rotational transition at bending residues and can be used
to identify hinge bending residues.
Probably only informative for interdomain rotations greater than 20 degrees
Residue
iResidue
i+1Distance of hinge axis to residue i in
(A) Distance of hinge axis to residue i in
(A) Change in
(deg) Change in
(deg) Angle of psi(i) axis to hinge axis
(deg) Angle of psi(i) axis to hinge axis
(deg) Percentage Progress
LEU-613
PHE-614
7.5
7.2
2.6
-23.7
111.5
119.6
57.4
PHE-614
GLY-615
4.5
4.7
-129.1
24.1
30.7
14.5
450.3
GLY-615
ASN-616
5.8
4.6
111.0
-16.4
121.9
112.3
-242.6

Graph shows rotational transition at bending residues and can be used
to identify hinge bending residues.
Probably only informative for interdomain rotations greater than 20 degrees