Ferrochelatase
(All numbering and residues are taken from first PDB file)
![]()
![]()
Bending Residue Dihedral Analysis
Residue
iResidue
i+1Distance of hinge axis to residue i in
(A) Distance of hinge axis to residue i in
(A) Change in
(deg) Change in
(deg) Angle of psi(i) axis to hinge axis
(deg) Angle of psi(i) axis to hinge axis
(deg) Percentage Progress
MET-73
LEU-74
4.9
5.2
-15.0
14.2
59.3
57.0
22.3
LEU-74
ASN-75
2.6
2.5
2.8
-2.8
137.2
137.5
-34.3
ASN-75
MET-76
3.7
3.5
-12.4
-0.4
54.9
56.0
112.7

Graph shows rotational transition at bending residues and can be used
to identify hinge bending residues.
Probably only informative for interdomain rotations greater than 20 degrees
Residue
iResidue
i+1Distance of hinge axis to residue i in
(A) Distance of hinge axis to residue i in
(A) Change in
(deg) Change in
(deg) Angle of psi(i) axis to hinge axis
(deg) Angle of psi(i) axis to hinge axis
(deg) Percentage Progress
GLY-78
PRO-79
1.0
1.4
8.8
-10.9
54.4
60.7
-23.5
PRO-79
GLU-80
1.4
1.4
-0.4
12.7
103.5
110.3
79.5
GLU-80
THR-81
4.6
4.7
4.1
-14.9
6.9
9.3
-96.7
THR-81
LEU-82
4.8
4.8
-0.2
4.5
110.7
110.7
24.6

Graph shows rotational transition at bending residues and can be used
to identify hinge bending residues.
Probably only informative for interdomain rotations greater than 20 degrees
Residue
iResidue
i+1Distance of hinge axis to residue i in
(A) Distance of hinge axis to residue i in
(A) Change in
(deg) Change in
(deg) Angle of psi(i) axis to hinge axis
(deg) Angle of psi(i) axis to hinge axis
(deg) Percentage Progress
GLU-121
GLN-122
4.1
4.2
1.3
-6.5
120.4
119.7
50.2
GLN-122
TYR-123
6.4
6.3
4.9
-7.0
113.9
109.5
-1.2
TYR-123
ARG-124
4.3
4.0
5.6
-1.4
46.5
42.1
-1.4
ARG-124
ARG-125
4.4
3.9
1.2
3.7
76.8
78.3
11.0
ARG-125
ILE-126
7.8
7.4
-6.3
15.2
45.8
50.9
-66.0
ILE-126
GLY-127
9.0
8.6
-16.5
8.6
72.3
83.6
23.6
GLY-127
GLY-128
8.4
8.3
4.1
7.0
93.8
97.3
24.1
GLY-128
GLY-129
5.1
5.2
-5.6
7.6
25.6
23.6
-17.0
GLY-129
SER-130
4.1
4.4
-11.2
11.6
47.3
46.4
-1.7

Graph shows rotational transition at bending residues and can be used
to identify hinge bending residues.
Probably only informative for interdomain rotations greater than 20 degrees
Residue
iResidue
i+1Distance of hinge axis to residue i in
(A) Distance of hinge axis to residue i in
(A) Change in
(deg) Change in
(deg) Angle of psi(i) axis to hinge axis
(deg) Angle of psi(i) axis to hinge axis
(deg) Percentage Progress
PHE-163
ARG-164
1.3
1.6
2.4
-1.0
85.4
84.4
18.8
ARG-164
TYR-165
4.0
4.0
-5.3
6.8
42.4
42.0
1.1
TYR-165
VAL-166
5.2
5.2
-2.1
-8.3
53.3
52.4
43.1
VAL-166
HIS-167
4.4
4.4
10.4
-53.6
53.0
52.6
-94.5
HIS-167
PRO-168
7.3
6.8
-163.3
-14.4
151.4
99.1
-248.1
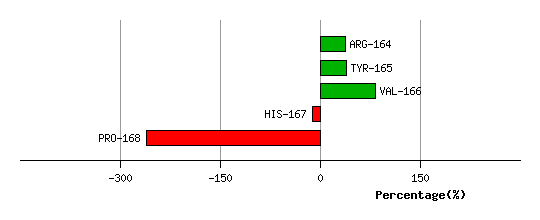
Graph shows rotational transition at bending residues and can be used
to identify hinge bending residues.
Probably only informative for interdomain rotations greater than 20 degrees