Beta-Actin
(All numbering and residues are taken from first PDB file)
![]()
![]()
Bending Residue Dihedral Analysis
Residue
iResidue
i+1Distance of hinge axis to residue i in
(A) Distance of hinge axis to residue i in
(A) Change in
(deg) Change in
(deg) Angle of psi(i) axis to hinge axis
(deg) Angle of psi(i) axis to hinge axis
(deg) Percentage Progress
ALA-7
LEU-8
5.0
4.7
-9.1
10.1
58.1
60.3
4.1
LEU-8
VAL-9
3.3
3.3
-13.0
13.4
29.4
25.9
-34.1
VAL-9
CYS-10
2.5
2.9
-3.0
-2.1
73.0
68.2
3.4

Graph shows rotational transition at bending residues and can be used
to identify hinge bending residues.
Probably only informative for interdomain rotations greater than 20 degrees
Residue
iResidue
i+1Distance of hinge axis to residue i in
(A) Distance of hinge axis to residue i in
(A) Change in
(deg) Change in
(deg) Angle of psi(i) axis to hinge axis
(deg) Angle of psi(i) axis to hinge axis
(deg) Percentage Progress
ILE-34
VAL-35
18.1
18.2
0.4
16.3
158.2
152.2
-172.1
VAL-35
GLY-36
20.1
20.5
1.9
12.2
78.9
74.5
-21.4
GLY-36
ARG-37
23.9
24.1
-26.8
24.2
36.8
57.2
44.4
ARG-37
PRO-38
26.4
26.9
-20.4
-5.8
99.0
99.4
-88.9
LYS-50
ASP-51
26.4
24.6
72.8
176.3
54.3
65.5
-970.0
ASP-51
SER-52
25.7
23.3
-64.1
45.2
158.5
103.4
-712.4
SER-52
TYR-53
23.6
23.4
168.7
60.2
85.9
73.5
-265.2
TYR-53
VAL-54
22.4
22.7
-23.3
1.6
128.5
124.8
-103.9
VAL-54
GLY-55
19.1
19.2
-15.6
26.8
122.5
108.7
106.2
GLY-55
ASP-56
18.5
18.1
-9.3
-1.8
108.7
119.3
-71.9

Graph shows rotational transition at bending residues and can be used
to identify hinge bending residues.
Probably only informative for interdomain rotations greater than 20 degrees
Residue
iResidue
i+1Distance of hinge axis to residue i in
(A) Distance of hinge axis to residue i in
(A) Change in
(deg) Change in
(deg) Angle of psi(i) axis to hinge axis
(deg) Angle of psi(i) axis to hinge axis
(deg) Percentage Progress
ASN-78
TRP-79
19.1
19.2
-5.4
-1.6
36.9
41.4
115.4
TRP-79
ASP-80
17.6
17.4
7.0
-2.1
133.3
140.4
-17.9
ASP-80
ASP-81
19.3
19.0
-5.3
-3.7
110.1
102.8
-5.0

Graph shows rotational transition at bending residues and can be used
to identify hinge bending residues.
Probably only informative for interdomain rotations greater than 20 degrees
Residue
iResidue
i+1Distance of hinge axis to residue i in
(A) Distance of hinge axis to residue i in
(A) Change in
(deg) Change in
(deg) Angle of psi(i) axis to hinge axis
(deg) Angle of psi(i) axis to hinge axis
(deg) Percentage Progress
THR-89
PHE-90
10.7
10.9
3.4
0.4
33.5
35.9
37.3
PHE-90
TYR-91
9.2
9.3
-3.7
11.4
125.3
125.7
14.4
TYR-91
ASN-92
12.3
12.4
-25.0
19.9
71.0
69.9
-0.9
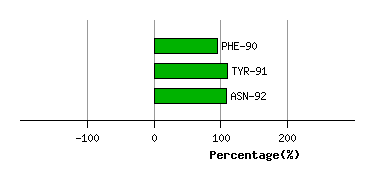
Graph shows rotational transition at bending residues and can be used
to identify hinge bending residues.
Probably only informative for interdomain rotations greater than 20 degrees
Residue
iResidue
i+1Distance of hinge axis to residue i in
(A) Distance of hinge axis to residue i in
(A) Change in
(deg) Change in
(deg) Angle of psi(i) axis to hinge axis
(deg) Angle of psi(i) axis to hinge axis
(deg) Percentage Progress
GLU-99
GLU-100
2.8
3.4
4.6
-12.5
99.8
109.0
14.6
GLU-100
HIS-101
1.6
1.3
5.9
-3.3
32.1
39.9
-79.7
HIS-101
PRO-102
1.8
1.6
22.3
-20.4
56.4
56.2
49.4

Graph shows rotational transition at bending residues and can be used
to identify hinge bending residues.
Probably only informative for interdomain rotations greater than 20 degrees
Residue
iResidue
i+1Distance of hinge axis to residue i in
(A) Distance of hinge axis to residue i in
(A) Change in
(deg) Change in
(deg) Angle of psi(i) axis to hinge axis
(deg) Angle of psi(i) axis to hinge axis
(deg) Percentage Progress
THR-106
GLU-107
3.9
4.0
-1.0
-0.3
71.1
68.8
-48.6
GLU-107
ALA-108
7.1
7.1
4.5
-4.8
174.6
171.7
101.5
ALA-108
PRO-109
8.0
7.9
-3.2
-0.5
69.9
76.6
-43.6

Graph shows rotational transition at bending residues and can be used
to identify hinge bending residues.
Probably only informative for interdomain rotations greater than 20 degrees
Residue
iResidue
i+1Distance of hinge axis to residue i in
(A) Distance of hinge axis to residue i in
(A) Change in
(deg) Change in
(deg) Angle of psi(i) axis to hinge axis
(deg) Angle of psi(i) axis to hinge axis
(deg) Percentage Progress
GLN-121
ILE-122
13.8
14.1
-1.6
3.0
69.7
66.5
0.0
ILE-122
MET-123
12.5
12.7
-2.3
-0.4
66.0
62.7
6.0
MET-123
PHE-124
8.8
9.1
5.2
-7.0
159.5
156.7
10.4
PHE-124
GLU-125
9.8
10.1
2.2
-3.4
49.7
48.6
5.0
PHE-124
GLU-125
9.8
10.1
2.2
-3.4
49.7
48.6
5.0

Graph shows rotational transition at bending residues and can be used
to identify hinge bending residues.
Probably only informative for interdomain rotations greater than 20 degrees
Residue
iResidue
i+1Distance of hinge axis to residue i in
(A) Distance of hinge axis to residue i in
(A) Change in
(deg) Change in
(deg) Angle of psi(i) axis to hinge axis
(deg) Angle of psi(i) axis to hinge axis
(deg) Percentage Progress
PHE-124
GLU-125
9.8
10.1
2.2
-3.4
49.7
48.6
5.0
PHE-124
GLU-125
9.8
10.1
2.2
-3.4
49.7
48.6
5.0
GLU-125
THR-126
12.6
12.9
3.3
-11.2
83.1
80.4
-37.7
THR-126
PHE-127
12.3
12.6
15.7
-6.1
73.8
77.0
70.4
PHE-127
ASN-128
8.7
9.0
-5.9
0.0
127.7
132.0
-14.6

Graph shows rotational transition at bending residues and can be used
to identify hinge bending residues.
Probably only informative for interdomain rotations greater than 20 degrees
Residue
iResidue
i+1Distance of hinge axis to residue i in
(A) Distance of hinge axis to residue i in
(A) Change in
(deg) Change in
(deg) Angle of psi(i) axis to hinge axis
(deg) Angle of psi(i) axis to hinge axis
(deg) Percentage Progress
LEU-346
ALA-347
9.1
9.3
-0.3
-9.0
172.6
172.6
-80.9
ALA-347
SER-348
7.4
7.9
14.9
-4.3
57.4
56.9
45.7
SER-348
LEU-349
10.4
10.8
-16.3
20.0
93.8
94.4
13.4
LEU-349
SER-350
12.9
13.5
65.3
-2.4
32.6
31.3
634.1
SER-350
THR-351
13.3
15.6
-3.0
-27.1
97.1
88.4
-91.0
THR-351
PHE-352
16.7
15.9
28.2
7.3
101.7
90.3
-160.5
PHE-352
GLN-353
14.8
12.3
-38.4
2.3
125.4
154.9
-309.0
GLN-353
GLN-354
12.6
12.2
-11.4
-33.0
100.9
99.3
-178.7
GLN-354
MET-355
14.6
14.3
24.5
-20.7
138.2
136.8
31.5

Graph shows rotational transition at bending residues and can be used
to identify hinge bending residues.
Probably only informative for interdomain rotations greater than 20 degrees
Residue
iResidue
i+1Distance of hinge axis to residue i in
(A) Distance of hinge axis to residue i in
(A) Change in
(deg) Change in
(deg) Angle of psi(i) axis to hinge axis
(deg) Angle of psi(i) axis to hinge axis
(deg) Percentage Progress
TRP-356
ILE-357
10.0
10.0
-0.9
2.4
112.5
107.6
51.0
ILE-357
THR-358
11.1
11.0
-2.3
1.7
149.8
153.3
29.7
THR-358
LYS-359
10.3
10.6
-0.5
0.7
108.2
112.2
41.3

Graph shows rotational transition at bending residues and can be used
to identify hinge bending residues.
Probably only informative for interdomain rotations greater than 20 degrees