Gelatinase A
(All numbering and residues are taken from first PDB file)
![]()
![]()
Bending Residue Dihedral Analysis
Residue
iResidue
i+1Distance of hinge axis to residue i in
(A) Distance of hinge axis to residue i in
(A) Change in
(deg) Change in
(deg) Angle of psi(i) axis to hinge axis
(deg) Angle of psi(i) axis to hinge axis
(deg) Percentage Progress
ILE-97
THR-98
7.9
4.2
10.2
15.0
141.7
103.8
-12.8
THR-98
TYR-99
7.3
1.0
-23.7
36.4
59.8
60.4
-8.1
TYR-99
ARG-100
5.0
3.8
-19.7
24.4
48.7
59.3
-5.4
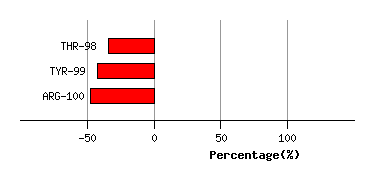
Graph shows rotational transition at bending residues and can be used
to identify hinge bending residues.
Probably only informative for interdomain rotations greater than 20 degrees
Residue
iResidue
i+1Distance of hinge axis to residue i in
(A) Distance of hinge axis to residue i in
(A) Change in
(deg) Change in
(deg) Angle of psi(i) axis to hinge axis
(deg) Angle of psi(i) axis to hinge axis
(deg) Percentage Progress
THR-112
VAL-113
4.7
10.8
-7.9
-11.8
32.2
152.5
9.0
VAL-113
ASP-114
2.3
11.7
38.9
108.0
140.3
42.6
27.6
ASP-114
ASP-115
5.3
9.1
77.9
-73.2
91.7
40.1
3.4
ASP-115
ALA-116
7.3
7.9
-162.3
-0.1
72.7
68.9
38.6
ALA-116
PHE-117
6.2
6.5
170.8
8.7
171.4
107.6
-91.5
PHE-117
ALA-118
5.1
9.4
-167.1
-4.8
59.5
132.4
17.8

Graph shows rotational transition at bending residues and can be used
to identify hinge bending residues.
Probably only informative for interdomain rotations greater than 20 degrees
Residue
iResidue
i+1Distance of hinge axis to residue i in
(A) Distance of hinge axis to residue i in
(A) Change in
(deg) Change in
(deg) Angle of psi(i) axis to hinge axis
(deg) Angle of psi(i) axis to hinge axis
(deg) Percentage Progress
GLU-139
ALA-140
9.2
8.1
8.3
-10.6
82.2
39.8
-0.3
ALA-140
ASP-141
6.3
5.7
-48.5
-24.6
119.3
120.3
-41.0
ASP-141
ILE-142
3.4
6.8
170.0
173.6
123.7
51.9
0.4
ILE-142
MET-143
1.1
5.6
113.5
-19.0
138.6
74.7
-67.0
MET-143
ILE-144
3.5
2.6
-44.0
-14.0
44.3
118.5
-7.4

Graph shows rotational transition at bending residues and can be used
to identify hinge bending residues.
Probably only informative for interdomain rotations greater than 20 degrees