Glutamate Receptor 2
(All numbering and residues are taken from first PDB file)
![]()
![]()
Bending Residue Dihedral Analysis
Residue
iResidue
i+1Distance of hinge axis to residue i in
(A) Distance of hinge axis to residue i in
(A) Change in
(deg) Change in
(deg) Angle of psi(i) axis to hinge axis
(deg) Angle of psi(i) axis to hinge axis
(deg) Percentage Progress
SER-108
LEU-109
2.7
2.8
7.4
-10.4
44.9
46.0
-24.9
LEU-109
GLY-110
1.8
1.1
5.3
-30.9
120.0
120.4
67.3
GLY-110
ILE-111
4.8
4.5
14.4
-0.1
44.3
46.1
32.6

Graph shows rotational transition at bending residues and can be used
to identify hinge bending residues.
Probably only informative for interdomain rotations greater than 20 degrees
Residue
iResidue
i+1Distance of hinge axis to residue i in
(A) Distance of hinge axis to residue i in
(A) Change in
(deg) Change in
(deg) Angle of psi(i) axis to hinge axis
(deg) Angle of psi(i) axis to hinge axis
(deg) Percentage Progress
ASP-216
SER-217
7.8
7.2
-2.3
8.9
83.7
81.6
-12.4
SER-217
LYS-218
4.1
3.5
2.6
23.6
70.8
84.6
41.1
LYS-218
GLY-219
3.8
4.0
-21.9
-0.8
55.5
73.0
38.3
GLY-219
TYR-220
5.0
4.9
-21.6
0.0
74.9
71.1
11.3
TYR-220
GLY-221
8.3
8.1
-10.3
3.0
124.7
120.2
3.2

Graph shows rotational transition at bending residues and can be used
to identify hinge bending residues.
Probably only informative for interdomain rotations greater than 20 degrees
Residue
iResidue
i+1Distance of hinge axis to residue i in
(A) Distance of hinge axis to residue i in
(A) Change in
(deg) Change in
(deg) Angle of psi(i) axis to hinge axis
(deg) Angle of psi(i) axis to hinge axis
(deg) Percentage Progress
LYS-253
TRP-254
11.9
11.8
-2.1
5.3
115.0
118.9
0.3
TRP-254
TRP-255
9.1
9.0
-1.1
1.8
97.4
100.1
-37.1
TRP-255
TYR-256
6.3
6.1
-55.2
-54.5
122.0
124.1
-302.2
TYR-256
ASP-257
9.0
8.6
-167.4
30.6
138.7
134.2
1091.8
ASP-257
LYS-258
8.0
11.4
-139.7
-19.8
146.0
143.2
-762.2
LYS-258
GLY-259
9.1
9.0
18.4
-148.0
60.3
77.7
-187.9
GLY-259
GLU-260
8.7
6.6
119.3
-52.7
45.8
12.1
320.3
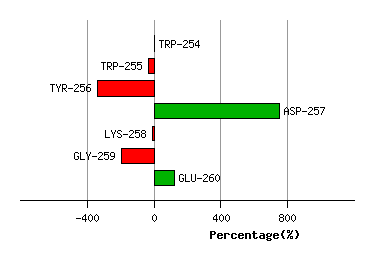
Graph shows rotational transition at bending residues and can be used
to identify hinge bending residues.
Probably only informative for interdomain rotations greater than 20 degrees