Hla Class I Histocompatibility Antigen
(All numbering and residues are taken from first PDB file)
![]()
![]()
Bending Residue Dihedral Analysis
Residue
iResidue
i+1Distance of hinge axis to residue i in
(A) Distance of hinge axis to residue i in
(A) Change in
(deg) Change in
(deg) Angle of psi(i) axis to hinge axis
(deg) Angle of psi(i) axis to hinge axis
(deg) Percentage Progress
PRO-185
LYS-186
9.1
9.5
3.9
-9.3
57.0
52.3
-30.0
LYS-186
THR-187
12.5
12.6
17.0
-13.7
63.6
69.1
66.7
THR-187
HIS-188
11.7
11.9
7.2
-5.2
57.3
57.5
-37.0

Graph shows rotational transition at bending residues and can be used
to identify hinge bending residues.
Probably only informative for interdomain rotations greater than 20 degrees
Residue
iResidue
i+1Distance of hinge axis to residue i in
(A) Distance of hinge axis to residue i in
(A) Change in
(deg) Change in
(deg) Angle of psi(i) axis to hinge axis
(deg) Angle of psi(i) axis to hinge axis
(deg) Percentage Progress
TRP-204
ALA-205
11.8
11.9
-4.9
2.9
95.0
96.7
-21.2
ALA-205
LEU-206
9.2
9.5
5.1
-0.5
22.7
24.6
63.2
LEU-206
SER-207
11.1
11.4
-0.4
7.9
111.3
108.8
-15.0

Graph shows rotational transition at bending residues and can be used
to identify hinge bending residues.
Probably only informative for interdomain rotations greater than 20 degrees
Residue
iResidue
i+1Distance of hinge axis to residue i in
(A) Distance of hinge axis to residue i in
(A) Change in
(deg) Change in
(deg) Angle of psi(i) axis to hinge axis
(deg) Angle of psi(i) axis to hinge axis
(deg) Percentage Progress
ALA-211
GLU-212
2.3
2.3
10.0
-10.2
34.1
38.8
16.4
GLU-212
ILE-213
1.0
1.0
1.8
3.2
32.6
29.5
41.8
ILE-213
THR-214
0.9
0.8
0.8
-7.6
56.8
57.1
-64.0
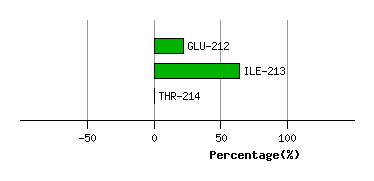
Graph shows rotational transition at bending residues and can be used
to identify hinge bending residues.
Probably only informative for interdomain rotations greater than 20 degrees
Residue
iResidue
i+1Distance of hinge axis to residue i in
(A) Distance of hinge axis to residue i in
(A) Change in
(deg) Change in
(deg) Angle of psi(i) axis to hinge axis
(deg) Angle of psi(i) axis to hinge axis
(deg) Percentage Progress
LEU-230
VAL-231
11.9
12.2
15.8
-10.9
4.2
11.6
34.2
VAL-231
GLU-232
12.1
12.4
6.8
-7.8
65.9
61.7
-11.8
GLU-232
THR-233
9.7
10.2
-6.8
1.4
97.0
95.3
28.0

Graph shows rotational transition at bending residues and can be used
to identify hinge bending residues.
Probably only informative for interdomain rotations greater than 20 degrees
Residue
iResidue
i+1Distance of hinge axis to residue i in
(A) Distance of hinge axis to residue i in
(A) Change in
(deg) Change in
(deg) Angle of psi(i) axis to hinge axis
(deg) Angle of psi(i) axis to hinge axis
(deg) Percentage Progress
PHE-241
GLN-242
7.4
7.9
1.4
-1.4
35.5
31.5
20.6
GLN-242
LYS-243
9.1
9.5
-10.0
5.9
111.0
108.4
-4.3
LYS-243
TRP-244
8.9
9.1
6.5
0.2
31.4
29.2
65.5

Graph shows rotational transition at bending residues and can be used
to identify hinge bending residues.
Probably only informative for interdomain rotations greater than 20 degrees
Residue
iResidue
i+1Distance of hinge axis to residue i in
(A) Distance of hinge axis to residue i in
(A) Change in
(deg) Change in
(deg) Angle of psi(i) axis to hinge axis
(deg) Angle of psi(i) axis to hinge axis
(deg) Percentage Progress
VAL-261
GLN-262
3.9
3.6
-4.5
5.2
93.6
97.3
13.8
GLN-262
HIS-263
2.1
2.2
3.7
-2.2
16.0
15.3
18.1
HIS-263
GLU-264
4.3
4.3
-3.1
2.5
88.2
91.8
55.0
GLU-264
GLY-265
7.4
7.4
4.3
-14.1
102.2
100.1
30.6
GLY-265
LEU-266
9.4
9.6
8.5
7.0
166.0
162.4
-200.8

Graph shows rotational transition at bending residues and can be used
to identify hinge bending residues.
Probably only informative for interdomain rotations greater than 20 degrees