Acetylcholine-Binding Protein
(All numbering and residues are taken from first PDB file)
![]()
![]()
Bending Residue Dihedral Analysis
Residue
iResidue
i+1Distance of hinge axis to residue i in
(A) Distance of hinge axis to residue i in
(A) Change in
(deg) Change in
(deg) Angle of psi(i) axis to hinge axis
(deg) Angle of psi(i) axis to hinge axis
(deg) Percentage Progress
LYS-10
SER-11
17.6
18.1
15.8
-23.9
138.5
135.7
37.3
SER-11
ASP-12
17.8
18.6
3.3
16.1
112.9
120.3
-49.0
ASP-12
LEU-13
15.0
15.8
-11.5
-17.7
122.4
109.8
-67.9
LEU-13
PHE-14
12.7
13.0
9.4
-1.3
82.5
68.5
32.8
PHE-14
ASN-15
13.4
14.6
8.3
6.1
142.8
136.4
-20.1
TYR-20
PRO-21
6.0
6.3
8.9
6.0
62.2
69.4
41.8
PRO-21
GLY-22
7.5
7.3
-12.4
8.4
159.8
150.5
-34.6
GLY-22
PRO-23
6.1
5.7
-7.1
-1.0
84.0
80.8
15.8

Graph shows rotational transition at bending residues and can be used
to identify hinge bending residues.
Probably only informative for interdomain rotations greater than 20 degrees
Residue
iResidue
i+1Distance of hinge axis to residue i in
(A) Distance of hinge axis to residue i in
(A) Change in
(deg) Change in
(deg) Angle of psi(i) axis to hinge axis
(deg) Angle of psi(i) axis to hinge axis
(deg) Percentage Progress
VAL-31
THR-32
1.3
1.5
3.2
-15.5
156.5
156.7
62.5
THR-32
LEU-33
3.5
3.8
-0.5
-3.1
57.3
58.0
-60.3
LEU-33
GLY-34
3.4
3.6
-2.9
-5.2
31.4
28.3
29.1

Graph shows rotational transition at bending residues and can be used
to identify hinge bending residues.
Probably only informative for interdomain rotations greater than 20 degrees
Residue
iResidue
i+1Distance of hinge axis to residue i in
(A) Distance of hinge axis to residue i in
(A) Change in
(deg) Change in
(deg) Angle of psi(i) axis to hinge axis
(deg) Angle of psi(i) axis to hinge axis
(deg) Percentage Progress
GLU-56
GLN-57
9.2
9.7
2.5
-12.3
139.6
143.6
24.3
GLN-57
GLN-58
8.9
9.0
3.4
-5.9
128.3
123.6
20.8
GLN-58
ARG-59
7.0
6.9
6.6
-13.5
134.7
138.5
58.1

Graph shows rotational transition at bending residues and can be used
to identify hinge bending residues.
Probably only informative for interdomain rotations greater than 20 degrees
Residue
iResidue
i+1Distance of hinge axis to residue i in
(A) Distance of hinge axis to residue i in
(A) Change in
(deg) Change in
(deg) Angle of psi(i) axis to hinge axis
(deg) Angle of psi(i) axis to hinge axis
(deg) Percentage Progress
TRP-60
LYS-61
5.0
5.0
12.8
-7.8
37.3
36.8
36.8
LYS-61
LEU-62
6.1
6.0
-10.1
10.5
147.1
146.4
-32.4
LEU-62
ASN-63
5.2
5.0
-8.3
17.3
137.7
139.6
61.7

Graph shows rotational transition at bending residues and can be used
to identify hinge bending residues.
Probably only informative for interdomain rotations greater than 20 degrees
Residue
iResidue
i+1Distance of hinge axis to residue i in
(A) Distance of hinge axis to residue i in
(A) Change in
(deg) Change in
(deg) Angle of psi(i) axis to hinge axis
(deg) Angle of psi(i) axis to hinge axis
(deg) Percentage Progress
TRP-86
THR-87
9.3
9.0
-2.4
1.8
159.8
160.6
1.3
THR-87
PRO-88
8.9
8.6
-7.0
15.2
111.0
110.6
44.0
PRO-88
ASP-89
7.1
6.5
3.8
-5.4
53.5
59.1
-20.3
ASP-89
ILE-90
9.9
9.1
-5.8
0.9
20.7
21.6
39.8
ASP-89
ILE-90
9.9
9.1
-5.8
0.9
20.7
21.6
39.8

Graph shows rotational transition at bending residues and can be used
to identify hinge bending residues.
Probably only informative for interdomain rotations greater than 20 degrees
Residue
iResidue
i+1Distance of hinge axis to residue i in
(A) Distance of hinge axis to residue i in
(A) Change in
(deg) Change in
(deg) Angle of psi(i) axis to hinge axis
(deg) Angle of psi(i) axis to hinge axis
(deg) Percentage Progress
ASP-89
ILE-90
9.9
9.1
-5.8
0.9
20.7
21.6
39.8
ASP-89
ILE-90
9.9
9.1
-5.8
0.9
20.7
21.6
39.8
ILE-90
THR-91
8.4
7.7
-4.1
9.7
52.9
52.8
-21.8
THR-91
ALA-92
11.1
10.6
-6.5
8.3
26.3
18.9
11.7
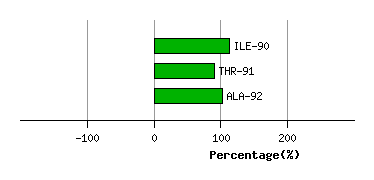
Graph shows rotational transition at bending residues and can be used
to identify hinge bending residues.
Probably only informative for interdomain rotations greater than 20 degrees
Residue
iResidue
i+1Distance of hinge axis to residue i in
(A) Distance of hinge axis to residue i in
(A) Change in
(deg) Change in
(deg) Angle of psi(i) axis to hinge axis
(deg) Angle of psi(i) axis to hinge axis
(deg) Percentage Progress
SER-146
TRP-147
8.6
8.3
6.9
-9.9
83.9
85.5
-3.3
TRP-147
VAL-148
12.4
12.0
18.1
-14.2
133.8
135.7
7.7
VAL-148
TYR-149
12.9
12.3
-3.1
-1.1
65.8
71.1
23.9

Graph shows rotational transition at bending residues and can be used
to identify hinge bending residues.
Probably only informative for interdomain rotations greater than 20 degrees
Residue
iResidue
i+1Distance of hinge axis to residue i in
(A) Distance of hinge axis to residue i in
(A) Change in
(deg) Change in
(deg) Angle of psi(i) axis to hinge axis
(deg) Angle of psi(i) axis to hinge axis
(deg) Percentage Progress
ASP-155
LEU-156
5.2
5.3
-12.5
-5.7
55.5
52.4
36.3
LEU-156
LYS-157
3.1
3.2
-15.4
-0.3
60.1
44.3
-10.2
LYS-157
THR-158
4.0
3.9
-0.2
-12.9
55.1
53.6
71.2

Graph shows rotational transition at bending residues and can be used
to identify hinge bending residues.
Probably only informative for interdomain rotations greater than 20 degrees
Residue
iResidue
i+1Distance of hinge axis to residue i in
(A) Distance of hinge axis to residue i in
(A) Change in
(deg) Change in
(deg) Angle of psi(i) axis to hinge axis
(deg) Angle of psi(i) axis to hinge axis
(deg) Percentage Progress
SER-178
ALA-179
3.2
3.2
-3.8
5.8
34.5
35.7
-23.1
ALA-179
THR-180
3.1
3.5
1.5
-5.3
133.9
135.2
-15.6
THR-180
GLN-181
1.2
1.2
-11.7
-6.3
32.8
27.9
71.2

Graph shows rotational transition at bending residues and can be used
to identify hinge bending residues.
Probably only informative for interdomain rotations greater than 20 degrees
Residue
iResidue
i+1Distance of hinge axis to residue i in
(A) Distance of hinge axis to residue i in
(A) Change in
(deg) Change in
(deg) Angle of psi(i) axis to hinge axis
(deg) Angle of psi(i) axis to hinge axis
(deg) Percentage Progress
ASN-199
LEU-200
5.0
4.9
-1.4
0.3
50.7
55.9
3.8
LEU-200
VAL-201
3.9
4.1
-1.4
-10.1
24.6
21.9
22.4
VAL-201
VAL-202
4.0
4.0
-6.9
2.9
51.9
53.1
83.2

Graph shows rotational transition at bending residues and can be used
to identify hinge bending residues.
Probably only informative for interdomain rotations greater than 20 degrees