Glutamate Dehydrogenase, Nad-Specific Glutamate Dehydrogenase, Glutamate Dehydrogenase
(All numbering and residues are taken from first PDB file)
![]()
![]()
Bending Residue Dihedral Analysis
Residue
iResidue
i+1Distance of hinge axis to residue i in
(A) Distance of hinge axis to residue i in
(A) Change in
(deg) Change in
(deg) Angle of psi(i) axis to hinge axis
(deg) Angle of psi(i) axis to hinge axis
(deg) Percentage Progress
TYR-212
GLY-213
6.3
6.6
13.8
-11.6
115.8
119.3
-3.8
GLY-213
LEU-214
3.7
4.1
0.0
-2.2
111.1
111.7
-21.1
LEU-214
VAL-215
2.9
3.0
-16.7
29.4
138.5
133.6
69.3
VAL-215
TYR-216
1.4
1.5
-10.3
5.3
73.3
67.6
44.7

Graph shows rotational transition at bending residues and can be used
to identify hinge bending residues.
Probably only informative for interdomain rotations greater than 20 degrees
Residue
iResidue
i+1Distance of hinge axis to residue i in
(A) Distance of hinge axis to residue i in
(A) Change in
(deg) Change in
(deg) Angle of psi(i) axis to hinge axis
(deg) Angle of psi(i) axis to hinge axis
(deg) Percentage Progress
TYR-245
ALA-246
10.3
10.3
5.6
-9.8
95.3
93.3
53.8
ALA-246
ILE-247
7.0
7.1
-8.6
16.5
14.2
12.6
-52.4
ILE-247
GLU-248
7.7
7.9
-7.2
6.9
76.9
82.2
13.8
GLU-248
LYS-249
9.1
9.2
1.1
-12.1
80.4
82.9
48.2
LYS-249
ALA-250
6.6
6.7
12.8
-4.6
128.7
125.6
-16.6
ALA-250
MET-251
3.6
3.7
5.3
-2.2
152.8
149.8
-50.5

Graph shows rotational transition at bending residues and can be used
to identify hinge bending residues.
Probably only informative for interdomain rotations greater than 20 degrees
Residue
iResidue
i+1Distance of hinge axis to residue i in
(A) Distance of hinge axis to residue i in
(A) Change in
(deg) Change in
(deg) Angle of psi(i) axis to hinge axis
(deg) Angle of psi(i) axis to hinge axis
(deg) Percentage Progress
ALA-370
ALA-371
4.0
4.4
19.0
-16.0
140.5
142.9
-64.2
ALA-371
ASN-372
3.6
3.9
-9.4
9.4
88.6
88.4
24.4
ASN-372
ALA-373
5.5
5.7
11.3
2.1
41.2
38.4
130.4

Graph shows rotational transition at bending residues and can be used
to identify hinge bending residues.
Probably only informative for interdomain rotations greater than 20 degrees
Residue
iResidue
i+1Distance of hinge axis to residue i in
(A) Distance of hinge axis to residue i in
(A) Change in
(deg) Change in
(deg) Angle of psi(i) axis to hinge axis
(deg) Angle of psi(i) axis to hinge axis
(deg) Percentage Progress
HIS-402
HIS-403
8.1
8.0
0.0
0.5
60.2
60.3
73.2
HIS-403
ILE-404
9.6
9.5
7.3
-3.1
136.3
135.9
-26.5
ILE-404
MET-405
7.1
6.9
-10.6
2.1
108.7
111.0
4.5
MET-405
THR-406
4.2
4.0
-7.2
8.7
99.9
100.8
-9.0
THR-406
ASP-407
7.1
6.7
-11.1
6.9
31.6
33.5
53.7
ASP-407
ILE-408
8.0
7.9
15.3
-13.6
108.0
110.0
-43.0
ILE-408
HIS-409
5.0
4.8
-3.8
9.1
117.1
116.6
10.3
HIS-409
ASP-410
6.9
6.6
-5.3
3.0
68.3
64.8
-34.8
ASP-410
GLY-411
10.3
9.9
-4.6
-3.6
26.1
27.7
86.8
GLY-411
SER-412
9.5
9.7
12.3
-12.7
92.0
91.4
38.6
GLY-411
SER-412
9.5
9.7
12.3
-12.7
92.0
91.4
38.6

Graph shows rotational transition at bending residues and can be used
to identify hinge bending residues.
Probably only informative for interdomain rotations greater than 20 degrees
Residue
iResidue
i+1Distance of hinge axis to residue i in
(A) Distance of hinge axis to residue i in
(A) Change in
(deg) Change in
(deg) Angle of psi(i) axis to hinge axis
(deg) Angle of psi(i) axis to hinge axis
(deg) Percentage Progress
GLY-411
SER-412
9.5
9.7
12.3
-12.7
92.0
91.4
38.6
GLY-411
SER-412
9.5
9.7
12.3
-12.7
92.0
91.4
38.6
SER-412
ALA-413
9.1
9.0
31.0
-38.1
71.8
64.2
-87.1
ALA-413
ALA-414
12.2
12.2
-17.6
30.9
53.2
54.0
-174.8
ALA-414
ALA-415
13.9
13.9
-82.4
16.4
39.2
36.7
867.3
ALA-415
ALA-416
13.3
14.2
138.4
-135.6
77.7
82.3
0.2
ALA-416
GLU-417
15.2
13.9
27.4
-4.8
83.9
57.4
100.0
GLU-417
ARG-418
17.6
17.3
-31.9
-110.7
31.0
50.6
-1219.7
ARG-418
TYR-419
18.3
18.8
5.7
168.7
109.2
134.2
984.6
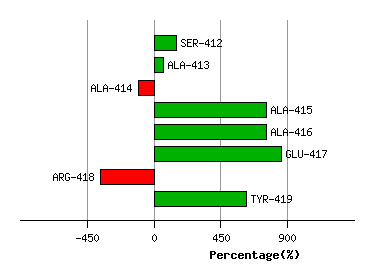
Graph shows rotational transition at bending residues and can be used
to identify hinge bending residues.
Probably only informative for interdomain rotations greater than 20 degrees
Residue
iResidue
i+1Distance of hinge axis to residue i in
(A) Distance of hinge axis to residue i in
(A) Change in
(deg) Change in
(deg) Angle of psi(i) axis to hinge axis
(deg) Angle of psi(i) axis to hinge axis
(deg) Percentage Progress
ASN-430
ILE-431
9.9
9.5
-10.0
8.0
136.8
132.6
-1.0
ILE-431
VAL-432
10.6
10.8
13.2
-5.3
73.9
79.3
72.5
VAL-432
GLY-433
8.1
8.2
-13.3
11.0
118.7
122.6
-37.8

Graph shows rotational transition at bending residues and can be used
to identify hinge bending residues.
Probably only informative for interdomain rotations greater than 20 degrees