Proto-Oncogene Tyrosine-Protein Kinase Fes/fps
(All numbering and residues are taken from first PDB file)
![]()
![]()
Bending Residue Dihedral Analysis
Residue
iResidue
i+1Distance of hinge axis to residue i in
(A) Distance of hinge axis to residue i in
(A) Change in
(deg) Change in
(deg) Angle of psi(i) axis to hinge axis
(deg) Angle of psi(i) axis to hinge axis
(deg) Percentage Progress
GLN-458
LEU-459
11.8
12.0
-4.2
-2.0
60.5
62.2
27.2
LEU-459
TRP-460
10.4
10.3
3.6
0.9
59.6
59.5
51.7
TRP-460
TYR-461
11.0
10.9
6.3
-13.0
29.5
29.4
-58.8
TYR-461
HIS-462
8.6
8.6
-1.0
1.8
75.5
75.6
-3.9
HIS-462
GLY-463
5.5
5.4
9.4
-12.5
46.3
43.2
-10.1
GLY-463
ALA-464
3.5
3.5
6.8
1.1
62.4
69.5
75.8
ALA-464
ILE-465
2.0
1.8
-4.6
20.3
60.7
62.4
93.7
ILE-465
PRO-466
5.1
5.0
-21.7
-6.6
131.3
130.9
-253.7

Graph shows rotational transition at bending residues and can be used
to identify hinge bending residues.
Probably only informative for interdomain rotations greater than 20 degrees
Residue
iResidue
i+1Distance of hinge axis to residue i in
(A) Distance of hinge axis to residue i in
(A) Change in
(deg) Change in
(deg) Angle of psi(i) axis to hinge axis
(deg) Angle of psi(i) axis to hinge axis
(deg) Percentage Progress
VAL-470
ALA-471
11.5
11.5
3.2
8.6
109.9
105.5
-88.9
ALA-471
GLU-472
15.1
15.0
-23.9
8.5
6.8
5.0
207.7
GLU-472
LEU-473
14.3
14.4
4.5
-2.3
117.1
115.2
-44.2
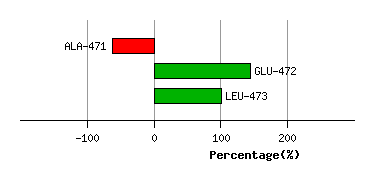
Graph shows rotational transition at bending residues and can be used
to identify hinge bending residues.
Probably only informative for interdomain rotations greater than 20 degrees
Residue
iResidue
i+1Distance of hinge axis to residue i in
(A) Distance of hinge axis to residue i in
(A) Change in
(deg) Change in
(deg) Angle of psi(i) axis to hinge axis
(deg) Angle of psi(i) axis to hinge axis
(deg) Percentage Progress
ARG-483
GLU-484
7.2
7.1
-8.2
11.4
20.6
21.2
-19.1
GLU-484
SER-485
5.0
5.0
18.3
14.6
113.6
114.0
-391.8
GLN-489
GLU-490
3.3
5.0
85.8
-4.9
91.0
109.8
-281.8
GLU-490
TYR-491
7.0
7.0
-42.2
4.4
165.2
157.9
-512.7
TYR-491
VAL-492
8.8
8.6
2.6
-1.4
92.2
93.0
5.6
VAL-492
LEU-493
10.6
10.5
-0.5
-0.4
150.2
147.9
-20.9

Graph shows rotational transition at bending residues and can be used
to identify hinge bending residues.
Probably only informative for interdomain rotations greater than 20 degrees
Residue
iResidue
i+1Distance of hinge axis to residue i in
(A) Distance of hinge axis to residue i in
(A) Change in
(deg) Change in
(deg) Angle of psi(i) axis to hinge axis
(deg) Angle of psi(i) axis to hinge axis
(deg) Percentage Progress
LYS-551
ASP-552
6.4
6.4
1.3
7.3
11.5
14.8
170.8
ASP-552
LYS-553
5.1
5.2
1.6
-4.7
76.8
70.9
24.1
LYS-553
TRP-554
2.5
2.8
0.9
-5.1
109.9
107.1
31.8

Graph shows rotational transition at bending residues and can be used
to identify hinge bending residues.
Probably only informative for interdomain rotations greater than 20 degrees
Residue
iResidue
i+1Distance of hinge axis to residue i in
(A) Distance of hinge axis to residue i in
(A) Change in
(deg) Change in
(deg) Angle of psi(i) axis to hinge axis
(deg) Angle of psi(i) axis to hinge axis
(deg) Percentage Progress
THR-627
GLN-628
2.0
2.0
4.3
-4.9
59.4
58.3
16.9
GLN-628
LYS-629
2.0
2.0
8.8
-10.1
17.8
21.3
14.1
LYS-629
GLN-630
3.0
3.2
1.7
-8.1
83.1
82.2
43.6
GLN-630
PRO-631
4.6
4.9
-5.1
-5.8
91.7
87.5
31.2

Graph shows rotational transition at bending residues and can be used
to identify hinge bending residues.
Probably only informative for interdomain rotations greater than 20 degrees