Serum Albumin
(All numbering and residues are taken from first PDB file)
![]()
![]()
Bending Residue Dihedral Analysis
Residue
iResidue
i+1Distance of hinge axis to residue i in
(A) Distance of hinge axis to residue i in
(A) Change in
(deg) Change in
(deg) Angle of psi(i) axis to hinge axis
(deg) Angle of psi(i) axis to hinge axis
(deg) Percentage Progress
SER-193
ALA-194
12.2
12.1
-3.2
6.4
58.3
51.3
-5.8
ALA-194
LYS-195
14.5
14.3
-5.8
-1.4
9.6
15.4
35.2
LYS-195
GLN-196
12.6
12.4
0.1
-1.8
111.9
102.9
-10.8

Graph shows rotational transition at bending residues and can be used
to identify hinge bending residues.
Probably only informative for interdomain rotations greater than 20 degrees
Residue
iResidue
i+1Distance of hinge axis to residue i in
(A) Distance of hinge axis to residue i in
(A) Change in
(deg) Change in
(deg) Angle of psi(i) axis to hinge axis
(deg) Angle of psi(i) axis to hinge axis
(deg) Percentage Progress
LYS-281
PRO-282
13.0
11.4
-12.2
10.3
90.2
78.2
11.9
PRO-282
LEU-283
14.8
12.1
-13.5
12.8
109.9
110.7
11.7
LEU-283
LEU-284
15.0
11.3
-15.2
-5.8
63.5
80.3
17.1
LEU-284
GLU-285
12.9
8.4
10.4
27.1
78.3
75.5
35.4
GLU-285
LYS-286
9.6
6.6
-41.4
2.3
162.6
173.1
-154.4
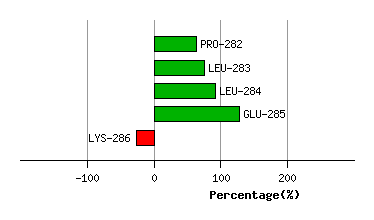
Graph shows rotational transition at bending residues and can be used
to identify hinge bending residues.
Probably only informative for interdomain rotations greater than 20 degrees