Actin Alpha 1
(All numbering and residues are taken from first PDB file)
![]()
![]()
Bending Residue Dihedral Analysis
Residue
iResidue
i+1Distance of hinge axis to residue i in
(A) Distance of hinge axis to residue i in
(A) Change in
(deg) Change in
(deg) Angle of psi(i) axis to hinge axis
(deg) Angle of psi(i) axis to hinge axis
(deg) Percentage Progress
LEU-8
VAL-9
13.0
12.9
-1.7
-0.8
68.7
73.0
34.3
VAL-9
VAL-10
10.6
10.5
8.1
2.0
105.4
109.3
-146.9
VAL-10
ASP-11
7.1
6.8
9.1
-16.8
111.0
111.8
178.9
ASP-11
ASN-12
4.6
4.4
-12.9
-3.8
91.7
83.3
18.1
ASN-12
GLY-13
1.1
1.1
10.3
-7.8
136.5
120.3
78.8
GLY-13
SER-14
1.2
1.7
21.1
-4.6
87.2
85.6
-10.2

Graph shows rotational transition at bending residues and can be used
to identify hinge bending residues.
Probably only informative for interdomain rotations greater than 20 degrees
Residue
iResidue
i+1Distance of hinge axis to residue i in
(A) Distance of hinge axis to residue i in
(A) Change in
(deg) Change in
(deg) Angle of psi(i) axis to hinge axis
(deg) Angle of psi(i) axis to hinge axis
(deg) Percentage Progress
CYS-17
LYS-18
4.7
4.9
-18.7
14.5
112.2
120.8
17.5
LYS-18
ALA-19
6.7
6.3
-3.5
-5.2
36.7
35.8
86.8
ALA-19
GLY-20
9.5
9.0
6.0
-14.4
75.1
75.5
-37.4

Graph shows rotational transition at bending residues and can be used
to identify hinge bending residues.
Probably only informative for interdomain rotations greater than 20 degrees
Residue
iResidue
i+1Distance of hinge axis to residue i in
(A) Distance of hinge axis to residue i in
(A) Change in
(deg) Change in
(deg) Angle of psi(i) axis to hinge axis
(deg) Angle of psi(i) axis to hinge axis
(deg) Percentage Progress
PRO-27
ARG-28
11.9
11.3
-20.2
8.9
81.7
79.8
88.9
ARG-28
ALA-29
14.4
13.6
-17.9
40.9
82.3
88.8
-32.4
ALA-29
VAL-30
12.1
11.7
-23.4
5.5
81.6
69.4
86.9
VAL-30
PHE-31
9.1
8.9
-14.8
-3.0
92.9
85.1
-2.2
PHE-31
PRO-32
9.5
9.5
1.2
-2.2
81.6
73.0
-57.8

Graph shows rotational transition at bending residues and can be used
to identify hinge bending residues.
Probably only informative for interdomain rotations greater than 20 degrees
Residue
iResidue
i+1Distance of hinge axis to residue i in
(A) Distance of hinge axis to residue i in
(A) Change in
(deg) Change in
(deg) Angle of psi(i) axis to hinge axis
(deg) Angle of psi(i) axis to hinge axis
(deg) Percentage Progress
TYR-91
ASN-92
15.8
15.9
-10.9
7.0
33.8
31.3
-19.1
ASN-92
GLU-93
16.4
16.6
1.9
-2.2
142.6
144.7
-38.9
GLU-93
LEU-94
14.7
14.7
5.6
-1.4
84.5
84.1
40.7

Graph shows rotational transition at bending residues and can be used
to identify hinge bending residues.
Probably only informative for interdomain rotations greater than 20 degrees
Residue
iResidue
i+1Distance of hinge axis to residue i in
(A) Distance of hinge axis to residue i in
(A) Change in
(deg) Change in
(deg) Angle of psi(i) axis to hinge axis
(deg) Angle of psi(i) axis to hinge axis
(deg) Percentage Progress
GLU-99
GLU-100
13.8
14.0
-5.6
10.6
98.1
98.9
5.2
GLU-100
HIS-101
16.9
17.0
1.3
5.0
45.5
49.1
110.5
HIS-101
PRO-102
15.5
15.3
-15.5
12.8
87.0
84.2
66.5

Graph shows rotational transition at bending residues and can be used
to identify hinge bending residues.
Probably only informative for interdomain rotations greater than 20 degrees
Residue
iResidue
i+1Distance of hinge axis to residue i in
(A) Distance of hinge axis to residue i in
(A) Change in
(deg) Change in
(deg) Angle of psi(i) axis to hinge axis
(deg) Angle of psi(i) axis to hinge axis
(deg) Percentage Progress
LEU-105
THR-106
6.4
6.4
0.1
-5.0
121.3
119.0
-32.3
THR-106
GLU-107
5.8
6.1
2.0
2.4
76.8
78.9
67.8
GLU-107
ALA-108
5.9
6.5
1.3
-9.0
137.1
135.4
91.3

Graph shows rotational transition at bending residues and can be used
to identify hinge bending residues.
Probably only informative for interdomain rotations greater than 20 degrees
Residue
iResidue
i+1Distance of hinge axis to residue i in
(A) Distance of hinge axis to residue i in
(A) Change in
(deg) Change in
(deg) Angle of psi(i) axis to hinge axis
(deg) Angle of psi(i) axis to hinge axis
(deg) Percentage Progress
LEU-110
ASN-111
13.6
13.9
-3.0
-7.8
53.6
48.4
96.0
ASN-111
PRO-112
10.7
11.0
-4.6
-0.8
26.3
21.4
19.5
PRO-112
LYS-113
12.2
12.2
6.9
-11.4
133.9
126.6
32.3

Graph shows rotational transition at bending residues and can be used
to identify hinge bending residues.
Probably only informative for interdomain rotations greater than 20 degrees
Residue
iResidue
i+1Distance of hinge axis to residue i in
(A) Distance of hinge axis to residue i in
(A) Change in
(deg) Change in
(deg) Angle of psi(i) axis to hinge axis
(deg) Angle of psi(i) axis to hinge axis
(deg) Percentage Progress
ASN-128
THR-129
9.6
9.7
-2.4
-2.5
54.6
54.5
112.8
THR-129
PRO-130
10.6
10.7
-1.1
6.3
121.8
127.5
44.1
PRO-130
ALA-131
13.5
13.2
-16.4
19.3
75.5
77.2
-42.2
ALA-131
MET-132
12.6
12.6
-0.3
2.5
39.8
38.9
-15.7
MET-132
TYR-133
10.3
10.3
-1.6
3.2
74.1
76.5
-90.4
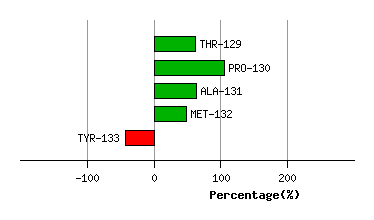
Graph shows rotational transition at bending residues and can be used
to identify hinge bending residues.
Probably only informative for interdomain rotations greater than 20 degrees
Residue
iResidue
i+1Distance of hinge axis to residue i in
(A) Distance of hinge axis to residue i in
(A) Change in
(deg) Change in
(deg) Angle of psi(i) axis to hinge axis
(deg) Angle of psi(i) axis to hinge axis
(deg) Percentage Progress
ALA-135
ILE-136
10.5
10.7
-3.8
-6.7
48.8
53.9
129.5
ILE-136
GLN-137
10.3
10.7
-6.2
-0.8
29.3
22.4
36.5
GLN-137
ALA-138
8.4
8.9
-2.6
1.6
44.8
49.3
17.4
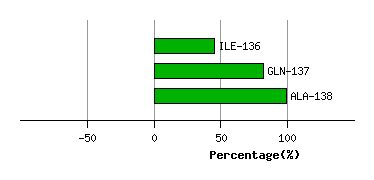
Graph shows rotational transition at bending residues and can be used
to identify hinge bending residues.
Probably only informative for interdomain rotations greater than 20 degrees
Residue
iResidue
i+1Distance of hinge axis to residue i in
(A) Distance of hinge axis to residue i in
(A) Change in
(deg) Change in
(deg) Angle of psi(i) axis to hinge axis
(deg) Angle of psi(i) axis to hinge axis
(deg) Percentage Progress
ARG-335
LYS-336
8.7
8.8
2.4
-5.8
114.1
113.6
-28.6
LYS-336
TYR-337
5.4
5.6
-1.3
-8.6
20.6
21.6
133.7
TYR-337
SER-338
7.5
7.5
8.0
-4.3
113.7
110.5
-22.3

Graph shows rotational transition at bending residues and can be used
to identify hinge bending residues.
Probably only informative for interdomain rotations greater than 20 degrees