Glutamate Receptor Subunit 2
(All numbering and residues are taken from first PDB file)
![]()
![]()
Bending Residue Dihedral Analysis
Residue
iResidue
i+1Distance of hinge axis to residue i in
(A) Distance of hinge axis to residue i in
(A) Change in
(deg) Change in
(deg) Angle of psi(i) axis to hinge axis
(deg) Angle of psi(i) axis to hinge axis
(deg) Percentage Progress
SER-108
LEU-109
3.8
3.5
-5.5
3.5
54.9
54.9
1.9
LEU-109
GLY-110
0.3
0.4
-3.3
22.1
128.9
127.8
51.6
GLY-110
ILE-111
3.6
3.7
-12.4
-4.1
54.8
55.1
35.2

Graph shows rotational transition at bending residues and can be used
to identify hinge bending residues.
Probably only informative for interdomain rotations greater than 20 degrees
Residue
iResidue
i+1Distance of hinge axis to residue i in
(A) Distance of hinge axis to residue i in
(A) Change in
(deg) Change in
(deg) Angle of psi(i) axis to hinge axis
(deg) Angle of psi(i) axis to hinge axis
(deg) Percentage Progress
LEU-215
ASP-216
9.1
9.2
-0.8
0.3
38.1
36.6
9.5
ASP-216
SER-217
5.9
6.1
-1.0
-5.3
107.1
108.2
-1.5
SER-217
LYS-218
2.3
2.6
-6.1
-18.8
79.9
68.0
48.2
LYS-218
GLY-219
1.8
1.5
16.2
5.3
63.6
50.2
41.9
GLY-219
TYR-220
4.4
4.4
16.4
-0.6
76.5
79.4
5.2
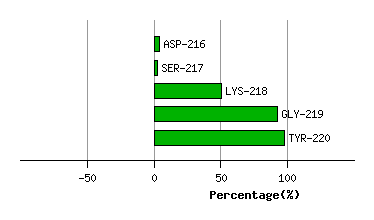
Graph shows rotational transition at bending residues and can be used
to identify hinge bending residues.
Probably only informative for interdomain rotations greater than 20 degrees
Residue
iResidue
i+1Distance of hinge axis to residue i in
(A) Distance of hinge axis to residue i in
(A) Change in
(deg) Change in
(deg) Angle of psi(i) axis to hinge axis
(deg) Angle of psi(i) axis to hinge axis
(deg) Percentage Progress
TRP-255
TYR-256
4.9
4.8
-13.5
7.2
48.3
47.6
16.0
TYR-256
ASP-257
6.9
6.3
7.4
-3.7
144.0
142.6
-32.0
ASP-257
LYS-258
9.4
8.8
162.4
177.2
131.9
125.1
67.0
LYS-258
GLY-259
6.9
6.9
-3.0
8.1
85.1
95.7
10.5
GLY-259
GLU-260
4.2
4.0
-11.7
14.2
16.3
24.4
-5.8

Graph shows rotational transition at bending residues and can be used
to identify hinge bending residues.
Probably only informative for interdomain rotations greater than 20 degrees