Hypothetical Transcriptional Regulator In Qaca 5'Region
(All numbering and residues are taken from first PDB file)
![]()
![]()
Bending Residue Dihedral Analysis
Residue
iResidue
i+1Distance of hinge axis to residue i in
(A) Distance of hinge axis to residue i in
(A) Change in
(deg) Change in
(deg) Angle of psi(i) axis to hinge axis
(deg) Angle of psi(i) axis to hinge axis
(deg) Percentage Progress
GLN-64
TRP-65
2.1
2.1
-3.0
11.8
97.2
98.8
31.6
TRP-65
LYS-66
5.8
5.9
13.4
-15.3
33.1
32.1
-11.3
LYS-66
LYS-67
7.4
7.0
-19.5
24.0
148.3
143.0
33.9

Graph shows rotational transition at bending residues and can be used
to identify hinge bending residues.
Probably only informative for interdomain rotations greater than 20 degrees
Residue
iResidue
i+1Distance of hinge axis to residue i in
(A) Distance of hinge axis to residue i in
(A) Change in
(deg) Change in
(deg) Angle of psi(i) axis to hinge axis
(deg) Angle of psi(i) axis to hinge axis
(deg) Percentage Progress
GLU-90
TYR-91
5.9
6.4
3.7
10.2
63.4
66.5
55.6
TYR-91
TYR-92
2.3
2.7
12.2
-13.5
49.2
41.6
-11.5
TYR-92
TYR-93
0.7
0.9
-6.9
8.4
121.7
128.0
-19.7

Graph shows rotational transition at bending residues and can be used
to identify hinge bending residues.
Probably only informative for interdomain rotations greater than 20 degrees
Residue
iResidue
i+1Distance of hinge axis to residue i in
(A) Distance of hinge axis to residue i in
(A) Change in
(deg) Change in
(deg) Angle of psi(i) axis to hinge axis
(deg) Angle of psi(i) axis to hinge axis
(deg) Percentage Progress
LYS-108
THR-109
11.2
10.2
-12.5
4.4
109.2
106.0
-3.9
THR-109
ASN-110
12.8
12.6
60.3
-46.1
29.0
43.5
97.6
ASN-110
SER-111
15.0
15.2
1.1
-4.7
30.0
23.1
-19.9
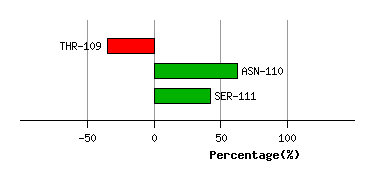
Graph shows rotational transition at bending residues and can be used
to identify hinge bending residues.
Probably only informative for interdomain rotations greater than 20 degrees
Residue
iResidue
i+1Distance of hinge axis to residue i in
(A) Distance of hinge axis to residue i in
(A) Change in
(deg) Change in
(deg) Angle of psi(i) axis to hinge axis
(deg) Angle of psi(i) axis to hinge axis
(deg) Percentage Progress
ASN-117
LYS-118
11.1
12.6
9.6
-27.7
167.5
153.6
120.3
LYS-118
LEU-119
12.0
13.9
46.4
-33.6
124.8
134.1
-69.8
LEU-119
GLU-120
8.5
10.4
18.2
-9.2
81.6
96.3
-10.3
GLU-120
ASN-121
9.4
11.4
35.2
-19.5
130.1
145.1
-77.5
ASN-121
LYS-122
12.8
13.7
-4.3
-17.8
13.2
36.3
162.2
LYS-122
TYR-123
11.2
10.9
21.4
-4.8
104.1
91.0
-6.5
TYR-123
ILE-124
10.3
9.5
-11.6
-30.4
101.6
75.5
34.3
ILE-124
ASP-125
13.7
13.0
28.7
17.3
145.1
149.7
-254.5
ASP-125
ALA-126
15.0
13.9
0.0
-4.4
37.4
46.6
59.7
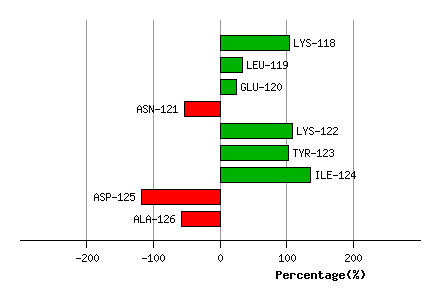
Graph shows rotational transition at bending residues and can be used
to identify hinge bending residues.
Probably only informative for interdomain rotations greater than 20 degrees