Mandelate Racemase/muconate Lactonizing Enzyme/enolase Superfamily
(All numbering and residues are taken from first PDB file)
![]()
![]()
Bending Residue Dihedral Analysis
Residue
iResidue
i+1Distance of hinge axis to residue i in
(A) Distance of hinge axis to residue i in
(A) Change in
(deg) Change in
(deg) Angle of psi(i) axis to hinge axis
(deg) Angle of psi(i) axis to hinge axis
(deg) Percentage Progress
ARG-135
PRO-136
7.5
7.1
7.6
3.2
75.2
71.8
44.1
PRO-136
TYR-137
4.8
4.7
4.8
-14.6
99.3
94.0
30.6
TYR-137
ALA-138
1.0
1.1
3.5
-19.3
99.3
93.2
51.8
ALA-138
SER-139
3.2
3.5
12.4
12.7
43.2
47.8
64.3
SER-139
LEU-140
5.6
5.7
-7.7
20.0
74.4
65.1
-40.6
LEU-140
LEU-141
8.8
8.5
-4.3
-0.5
128.5
125.9
-40.3
LEU-141
PHE-142
12.1
12.0
-11.1
-4.5
62.1
69.1
42.6
PHE-142
GLY-143
13.9
13.9
1.9
-4.6
118.5
117.6
-22.5

Graph shows rotational transition at bending residues and can be used
to identify hinge bending residues.
Probably only informative for interdomain rotations greater than 20 degrees
Residue
iResidue
i+1Distance of hinge axis to residue i in
(A) Distance of hinge axis to residue i in
(A) Change in
(deg) Change in
(deg) Angle of psi(i) axis to hinge axis
(deg) Angle of psi(i) axis to hinge axis
(deg) Percentage Progress
ILE-250
ALA-251
7.6
7.7
-1.2
8.7
94.5
95.7
1.4
ALA-251
GLY-252
3.9
4.0
-2.5
6.9
64.1
60.0
7.4
GLY-252
GLY-253
2.8
2.2
-15.5
8.8
71.4
81.5
33.2
GLY-253
GLU-254
3.4
2.9
1.1
2.0
67.1
64.5
37.7
GLU-254
ALA-255
6.4
5.7
1.4
-19.8
126.6
116.7
51.4
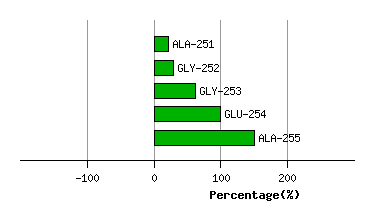
Graph shows rotational transition at bending residues and can be used
to identify hinge bending residues.
Probably only informative for interdomain rotations greater than 20 degrees
Residue
iResidue
i+1Distance of hinge axis to residue i in
(A) Distance of hinge axis to residue i in
(A) Change in
(deg) Change in
(deg) Angle of psi(i) axis to hinge axis
(deg) Angle of psi(i) axis to hinge axis
(deg) Percentage Progress
HIS-260
MET-261
6.5
6.8
-13.4
-0.9
69.0
65.9
-1.7
MET-261
ALA-262
5.1
5.0
1.1
5.7
131.5
129.6
-18.3
ALA-262
GLN-263
4.1
4.2
0.7
-2.3
61.0
56.9
2.4
GLN-263
HIS-264
4.6
4.8
5.4
8.2
64.7
64.9
31.3
HIS-264
LEU-265
1.3
1.3
-5.9
-6.5
49.1
49.5
17.6
LEU-265
MET-266
1.0
1.5
3.3
-0.7
104.5
97.6
14.0
MET-266
ASP-267
4.1
4.8
-3.2
-16.2
138.7
139.2
-57.4
ASP-267
TYR-268
5.4
6.0
-3.4
16.3
108.5
114.5
24.0
TYR-268
GLY-269
5.1
4.9
-10.0
-1.8
43.4
46.6
82.9
GLY-269
ARG-270
5.5
5.5
2.2
-9.5
127.2
123.5
28.5
ARG-270
ILE-271
7.9
7.8
1.1
6.3
166.7
171.8
-42.0
ILE-271
GLY-272
5.9
6.2
5.1
-9.8
116.8
118.7
-25.4
GLY-272
PHE-273
7.3
7.9
0.2
7.9
119.1
131.6
-22.8
PHE-273
ILE-274
4.3
5.1
-8.9
5.6
122.9
119.2
-0.7
ILE-274
GLN-275
2.8
3.5
2.6
5.7
134.8
136.0
-32.6
GLN-275
ILE-276
3.2
3.0
-3.0
1.4
114.2
112.2
-8.9
ILE-276
ASP-277
6.8
6.6
-3.3
1.6
52.1
53.0
-0.1
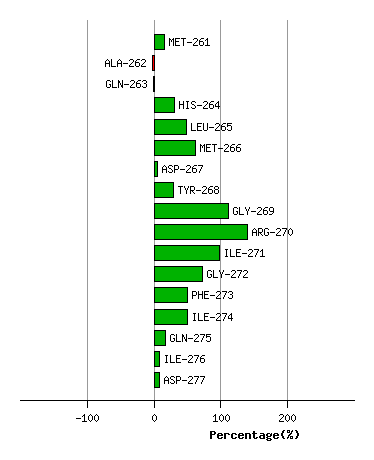
Graph shows rotational transition at bending residues and can be used
to identify hinge bending residues.
Probably only informative for interdomain rotations greater than 20 degrees