Virb11 Homolog
(All numbering and residues are taken from first PDB file)
![]()
![]()
Bending Residue Dihedral Analysis
Residue
iResidue
i+1Distance of hinge axis to residue i in
(A) Distance of hinge axis to residue i in
(A) Change in
(deg) Change in
(deg) Angle of psi(i) axis to hinge axis
(deg) Angle of psi(i) axis to hinge axis
(deg) Percentage Progress
SER-131
ILE-132
21.8
21.5
-22.9
15.2
41.5
44.3
121.5
ILE-132
ARG-133
21.7
21.7
14.3
-15.6
94.7
90.8
-50.4
ARG-133
ILE-134
18.7
18.9
24.9
-17.9
107.1
106.0
-30.3
ILE-134
PRO-135
20.1
19.9
-1.9
-5.5
62.3
56.9
-7.6

Graph shows rotational transition at bending residues and can be used
to identify hinge bending residues.
Probably only informative for interdomain rotations greater than 20 degrees
Residue
iResidue
i+1Distance of hinge axis to residue i in
(A) Distance of hinge axis to residue i in
(A) Change in
(deg) Change in
(deg) Angle of psi(i) axis to hinge axis
(deg) Angle of psi(i) axis to hinge axis
(deg) Percentage Progress
VAL-176
CYS-177
6.5
6.3
2.1
-7.1
113.5
113.3
90.4
CYS-177
GLY-178
3.7
3.5
-11.4
1.4
4.8
3.6
215.6
GLY-178
GLY-179
3.2
3.2
0.1
-3.7
104.2
100.8
0.3

Graph shows rotational transition at bending residues and can be used
to identify hinge bending residues.
Probably only informative for interdomain rotations greater than 20 degrees
Residue
iResidue
i+1Distance of hinge axis to residue i in
(A) Distance of hinge axis to residue i in
(A) Change in
(deg) Change in
(deg) Angle of psi(i) axis to hinge axis
(deg) Angle of psi(i) axis to hinge axis
(deg) Percentage Progress
THR-180
GLY-181
8.4
8.8
-6.0
2.0
128.9
127.7
10.2
GLY-181
SER-182
10.2
10.6
-8.2
5.5
105.0
108.0
16.6
SER-182
GLY-183
8.2
8.5
13.2
-15.8
117.0
117.8
40.9
GLY-183
LYS-184
11.2
11.6
19.9
-22.4
156.9
151.7
60.9

Graph shows rotational transition at bending residues and can be used
to identify hinge bending residues.
Probably only informative for interdomain rotations greater than 20 degrees
Residue
iResidue
i+1Distance of hinge axis to residue i in
(A) Distance of hinge axis to residue i in
(A) Change in
(deg) Change in
(deg) Angle of psi(i) axis to hinge axis
(deg) Angle of psi(i) axis to hinge axis
(deg) Percentage Progress
VAL-314
HIS-315
8.3
8.2
5.3
-3.3
128.1
126.2
49.0
HIS-315
ILE-316
5.9
5.8
12.1
-12.4
146.0
142.6
-20.5
ILE-316
ASN-317
6.5
6.3
2.0
-7.4
136.1
136.9
170.0
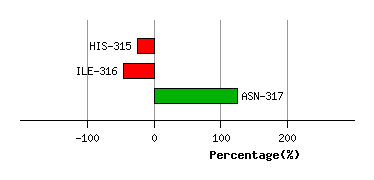
Graph shows rotational transition at bending residues and can be used
to identify hinge bending residues.
Probably only informative for interdomain rotations greater than 20 degrees
Residue
iResidue
i+1Distance of hinge axis to residue i in
(A) Distance of hinge axis to residue i in
(A) Change in
(deg) Change in
(deg) Angle of psi(i) axis to hinge axis
(deg) Angle of psi(i) axis to hinge axis
(deg) Percentage Progress
HIS-319
LYS-320
8.1
8.1
-9.6
2.8
47.6
45.5
129.6
LYS-320
GLN-321
9.9
9.8
-2.1
-1.1
85.7
82.3
0.8
GLN-321
CYS-322
10.4
10.4
-9.0
11.9
50.5
52.9
-18.6

Graph shows rotational transition at bending residues and can be used
to identify hinge bending residues.
Probably only informative for interdomain rotations greater than 20 degrees