Phosphoenolpyruvate Carboxykinase, Cytosolic [Gtp]
(All numbering and residues are taken from first PDB file)
![]()
![]()
Bending Residue Dihedral Analysis
Residue
iResidue
i+1Distance of hinge axis to residue i in
(A) Distance of hinge axis to residue i in
(A) Change in
(deg) Change in
(deg) Angle of psi(i) axis to hinge axis
(deg) Angle of psi(i) axis to hinge axis
(deg) Percentage Progress
ALA-282
ALA-283
7.8
7.9
-2.2
3.1
114.1
114.7
51.0
ALA-283
PHE-284
10.5
10.5
-7.9
2.5
124.3
124.3
15.1
PHE-284
PRO-285
12.2
12.3
5.8
-4.8
70.6
81.5
323.8
PRO-285
SER-286
15.3
15.7
4.2
4.0
122.8
126.2
-177.5
SER-286
ALA-287
18.5
19.0
-2.2
13.8
93.5
107.1
-110.4
ALA-287
CYS-288
19.1
19.6
-31.6
2.3
99.8
94.2
-149.3
CYS-288
GLY-289
15.6
15.9
-1.0
4.0
29.5
31.6
373.8
GLY-289
LYS-290
15.4
15.4
0.2
4.8
120.3
124.0
28.9
LYS-290
THR-291
13.7
13.5
8.5
-1.0
174.8
163.9
-302.1
THR-291
ASN-292
15.4
15.4
-3.9
2.5
67.7
69.5
-79.0
ASN-292
LEU-293
15.0
15.0
-3.7
-3.3
81.8
78.0
74.8
LEU-293
ALA-294
11.2
11.2
-1.3
3.1
37.0
37.7
-12.1

Graph shows rotational transition at bending residues and can be used
to identify hinge bending residues.
Probably only informative for interdomain rotations greater than 20 degrees
Residue
iResidue
i+1Distance of hinge axis to residue i in
(A) Distance of hinge axis to residue i in
(A) Change in
(deg) Change in
(deg) Angle of psi(i) axis to hinge axis
(deg) Angle of psi(i) axis to hinge axis
(deg) Percentage Progress
ARG-437
PRO-438
13.7
13.7
2.7
-5.4
87.0
88.1
55.8
PRO-438
ALA-439
16.7
16.7
-1.1
-2.9
121.6
119.6
-115.4
ALA-439
GLY-440
14.8
14.9
-2.1
3.2
94.3
96.0
45.1
GLY-440
VAL-441
11.7
11.8
3.5
-1.8
132.4
132.0
-5.0
VAL-441
PRO-442
9.5
9.6
-0.9
1.0
38.2
38.0
-28.4

Graph shows rotational transition at bending residues and can be used
to identify hinge bending residues.
Probably only informative for interdomain rotations greater than 20 degrees
Residue
iResidue
i+1Distance of hinge axis to residue i in
(A) Distance of hinge axis to residue i in
(A) Change in
(deg) Change in
(deg) Angle of psi(i) axis to hinge axis
(deg) Angle of psi(i) axis to hinge axis
(deg) Percentage Progress
PHE-512
HIS-513
0.3
0.4
-3.1
2.3
115.9
117.1
-21.7
HIS-513
VAL-514
3.5
3.5
-4.8
3.9
76.3
78.3
18.1
VAL-514
ASN-515
6.9
6.9
1.7
3.5
57.6
57.7
85.9
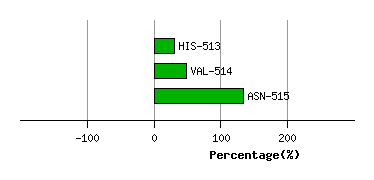
Graph shows rotational transition at bending residues and can be used
to identify hinge bending residues.
Probably only informative for interdomain rotations greater than 20 degrees
Residue
iResidue
i+1Distance of hinge axis to residue i in
(A) Distance of hinge axis to residue i in
(A) Change in
(deg) Change in
(deg) Angle of psi(i) axis to hinge axis
(deg) Angle of psi(i) axis to hinge axis
(deg) Percentage Progress
PHE-517
ARG-518
15.8
15.8
-7.5
2.2
29.5
34.0
166.2
ARG-518
LYS-519
15.7
15.8
-0.6
-1.1
92.1
93.3
-35.2
LYS-519
ASP-520
19.3
19.4
-5.4
-2.4
49.3
49.5
286.2
ASP-520
LYS-521
21.5
21.5
-1.3
9.8
40.8
43.0
-396.2
LYS-521
ASN-522
23.3
23.5
-7.8
-4.2
102.1
103.2
130.2
ASN-522
GLY-523
26.2
26.3
7.0
-3.9
60.6
58.4
41.0
GLY-523
LYS-524
24.1
24.2
4.0
-7.9
6.2
4.7
-232.5
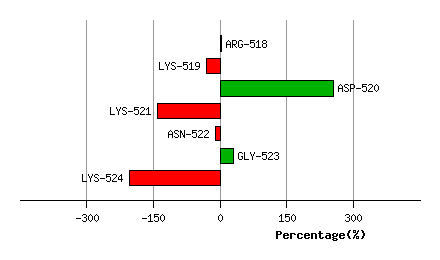
Graph shows rotational transition at bending residues and can be used
to identify hinge bending residues.
Probably only informative for interdomain rotations greater than 20 degrees
Residue
iResidue
i+1Distance of hinge axis to residue i in
(A) Distance of hinge axis to residue i in
(A) Change in
(deg) Change in
(deg) Angle of psi(i) axis to hinge axis
(deg) Angle of psi(i) axis to hinge axis
(deg) Percentage Progress
SER-534
ARG-535
10.0
10.0
-0.3
-0.1
68.4
67.8
-33.9
ARG-535
VAL-536
11.4
11.4
2.1
-2.8
133.7
134.9
10.3
VAL-536
LEU-537
8.8
8.8
-2.8
1.2
118.8
118.2
12.9

Graph shows rotational transition at bending residues and can be used
to identify hinge bending residues.
Probably only informative for interdomain rotations greater than 20 degrees
Residue
iResidue
i+1Distance of hinge axis to residue i in
(A) Distance of hinge axis to residue i in
(A) Change in
(deg) Change in
(deg) Angle of psi(i) axis to hinge axis
(deg) Angle of psi(i) axis to hinge axis
(deg) Percentage Progress
GLU-547
ASP-548
13.3
13.4
3.4
3.7
12.2
16.1
239.1
ASP-548
SER-549
15.3
15.3
11.5
-7.5
72.2
76.1
70.5
SER-549
ALA-550
13.7
13.6
-4.0
2.4
146.0
147.5
-8.7

Graph shows rotational transition at bending residues and can be used
to identify hinge bending residues.
Probably only informative for interdomain rotations greater than 20 degrees
Residue
iResidue
i+1Distance of hinge axis to residue i in
(A) Distance of hinge axis to residue i in
(A) Change in
(deg) Change in
(deg) Angle of psi(i) axis to hinge axis
(deg) Angle of psi(i) axis to hinge axis
(deg) Percentage Progress
LYS-551
LEU-552
12.9
12.9
-4.6
-0.1
50.3
50.8
112.5
LEU-552
THR-553
11.2
11.2
-3.1
3.5
46.0
42.5
85.9
THR-553
PRO-554
9.3
9.3
2.9
-1.0
123.3
122.0
-8.1

Graph shows rotational transition at bending residues and can be used
to identify hinge bending residues.
Probably only informative for interdomain rotations greater than 20 degrees
Residue
iResidue
i+1Distance of hinge axis to residue i in
(A) Distance of hinge axis to residue i in
(A) Change in
(deg) Change in
(deg) Angle of psi(i) axis to hinge axis
(deg) Angle of psi(i) axis to hinge axis
(deg) Percentage Progress
ILE-555
GLY-556
3.9
3.9
2.6
-5.8
148.8
150.5
102.2
GLY-556
TYR-557
5.3
5.3
-5.8
7.0
62.1
61.2
-63.0
TYR-557
VAL-558
7.7
7.7
-0.6
-1.7
68.4
69.6
18.8

Graph shows rotational transition at bending residues and can be used
to identify hinge bending residues.
Probably only informative for interdomain rotations greater than 20 degrees
Residue
iResidue
i+1Distance of hinge axis to residue i in
(A) Distance of hinge axis to residue i in
(A) Change in
(deg) Change in
(deg) Angle of psi(i) axis to hinge axis
(deg) Angle of psi(i) axis to hinge axis
(deg) Percentage Progress
LEU-569
GLY-570
21.8
21.7
121.2
2.7
119.9
128.3
-2500.5
GLY-570
ASP-571
23.9
24.9
83.1
-1.8
102.4
148.3
2988.9
ASP-571
VAL-572
24.8
24.8
-21.6
11.9
59.5
58.5
-23.6
VAL-572
ASN-573
21.4
21.4
3.5
-1.2
152.6
154.4
32.6

Graph shows rotational transition at bending residues and can be used
to identify hinge bending residues.
Probably only informative for interdomain rotations greater than 20 degrees