Histidinol-Phosphate Aminotransferase
(All numbering and residues are taken from first PDB file)
![]()
![]()
Bending Residue Dihedral Analysis
Residue
iResidue
i+1Distance of hinge axis to residue i in
(A) Distance of hinge axis to residue i in
(A) Change in
(deg) Change in
(deg) Angle of psi(i) axis to hinge axis
(deg) Angle of psi(i) axis to hinge axis
(deg) Percentage Progress
PRO-24
GLN-25
15.6
15.7
-2.9
0.3
109.2
110.3
-144.3
GLN-25
LEU-26
15.7
15.8
10.4
-7.5
129.9
129.8
20.2
LEU-26
ASN-27
16.2
16.3
9.3
-9.4
88.3
84.2
91.2
ASN-27
VAL-28
17.0
17.1
9.9
-7.1
153.0
144.0
-163.5

Graph shows rotational transition at bending residues and can be used
to identify hinge bending residues.
Probably only informative for interdomain rotations greater than 20 degrees
Residue
iResidue
i+1Distance of hinge axis to residue i in
(A) Distance of hinge axis to residue i in
(A) Change in
(deg) Change in
(deg) Angle of psi(i) axis to hinge axis
(deg) Angle of psi(i) axis to hinge axis
(deg) Percentage Progress
LEU-32
ASN-33
5.4
5.4
-3.8
7.7
84.6
84.7
0.6
ASN-33
THR-34
6.4
6.4
1.4
-5.0
150.6
148.2
-59.3
THR-34
ASN-35
5.8
5.7
-3.5
0.8
62.8
62.6
84.9

Graph shows rotational transition at bending residues and can be used
to identify hinge bending residues.
Probably only informative for interdomain rotations greater than 20 degrees
Residue
iResidue
i+1Distance of hinge axis to residue i in
(A) Distance of hinge axis to residue i in
(A) Change in
(deg) Change in
(deg) Angle of psi(i) axis to hinge axis
(deg) Angle of psi(i) axis to hinge axis
(deg) Percentage Progress
LEU-278
GLY-279
10.8
10.9
1.0
-2.7
135.6
132.6
51.5
GLY-279
THR-280
13.8
14.0
3.2
-6.2
150.7
152.2
45.3
THR-280
VAL-281
11.4
11.6
-1.5
4.1
60.4
58.9
11.2

Graph shows rotational transition at bending residues and can be used
to identify hinge bending residues.
Probably only informative for interdomain rotations greater than 20 degrees
Residue
iResidue
i+1Distance of hinge axis to residue i in
(A) Distance of hinge axis to residue i in
(A) Change in
(deg) Change in
(deg) Angle of psi(i) axis to hinge axis
(deg) Angle of psi(i) axis to hinge axis
(deg) Percentage Progress
TYR-300
ALA-301
5.8
5.8
9.9
-11.4
110.6
109.7
-28.9
ALA-301
VAL-302
9.2
9.1
-4.1
1.6
16.0
13.8
119.5
VAL-302
VAL-303
8.7
8.8
1.1
0.7
124.8
123.2
74.0
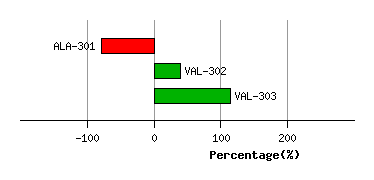
Graph shows rotational transition at bending residues and can be used
to identify hinge bending residues.
Probably only informative for interdomain rotations greater than 20 degrees
Residue
iResidue
i+1Distance of hinge axis to residue i in
(A) Distance of hinge axis to residue i in
(A) Change in
(deg) Change in
(deg) Angle of psi(i) axis to hinge axis
(deg) Angle of psi(i) axis to hinge axis
(deg) Percentage Progress
PHE-311
PHE-312
7.1
7.1
1.9
1.1
166.2
168.8
4.9
PHE-312
GLY-313
6.9
6.9
-3.3
2.9
57.4
58.1
86.7
GLY-313
ASP-314
8.6
8.7
2.4
0.3
161.3
161.8
-121.7

Graph shows rotational transition at bending residues and can be used
to identify hinge bending residues.
Probably only informative for interdomain rotations greater than 20 degrees
Residue
iResidue
i+1Distance of hinge axis to residue i in
(A) Distance of hinge axis to residue i in
(A) Change in
(deg) Change in
(deg) Angle of psi(i) axis to hinge axis
(deg) Angle of psi(i) axis to hinge axis
(deg) Percentage Progress
SER-316
ASP-317
14.3
14.3
2.7
-11.7
133.4
133.3
353.3
ASP-317
GLN-318
14.9
14.8
-1.5
-5.2
53.6
54.9
149.2
GLN-318
HIS-319
12.5
12.3
14.7
2.3
110.7
118.3
-382.2
HIS-319
ALA-320
14.3
14.4
-11.5
5.6
51.0
50.3
139.4
HIS-319
ALA-320
14.3
14.4
-11.5
5.6
51.0
50.3
139.4
Graph shows rotational transition at bending residues and can be used
to identify hinge bending residues.
Probably only informative for interdomain rotations greater than 20 degrees
Residue
iResidue
i+1Distance of hinge axis to residue i in
(A) Distance of hinge axis to residue i in
(A) Change in
(deg) Change in
(deg) Angle of psi(i) axis to hinge axis
(deg) Angle of psi(i) axis to hinge axis
(deg) Percentage Progress
HIS-319
ALA-320
14.3
14.4
-11.5
5.6
51.0
50.3
139.4
HIS-319
ALA-320
14.3
14.4
-11.5
5.6
51.0
50.3
139.4
ALA-320
ALA-321
14.2
14.2
2.2
-2.0
90.3
90.6
-131.9
ALA-321
TRP-322
10.4
10.4
3.6
-3.6
36.0
36.5
28.5

Graph shows rotational transition at bending residues and can be used
to identify hinge bending residues.
Probably only informative for interdomain rotations greater than 20 degrees
Residue
iResidue
i+1Distance of hinge axis to residue i in
(A) Distance of hinge axis to residue i in
(A) Change in
(deg) Change in
(deg) Angle of psi(i) axis to hinge axis
(deg) Angle of psi(i) axis to hinge axis
(deg) Percentage Progress
ILE-332
ARG-333
7.0
6.9
0.5
3.3
108.0
109.7
131.7
ARG-333
ASP-334
8.4
8.4
1.0
2.3
52.2
50.3
5.0
ASP-334
VAL-335
11.3
11.2
-6.2
10.5
41.7
42.1
-144.7
VAL-335
GLY-336
12.2
12.1
-7.3
6.5
77.3
79.2
-133.6
VAL-335
GLY-336
12.2
12.1
-7.3
6.5
77.3
79.2
-133.6

Graph shows rotational transition at bending residues and can be used
to identify hinge bending residues.
Probably only informative for interdomain rotations greater than 20 degrees
Residue
iResidue
i+1Distance of hinge axis to residue i in
(A) Distance of hinge axis to residue i in
(A) Change in
(deg) Change in
(deg) Angle of psi(i) axis to hinge axis
(deg) Angle of psi(i) axis to hinge axis
(deg) Percentage Progress
VAL-335
GLY-336
12.2
12.1
-7.3
6.5
77.3
79.2
-133.6
VAL-335
GLY-336
12.2
12.1
-7.3
6.5
77.3
79.2
-133.6
GLY-336
ILE-337
15.6
15.5
-3.2
2.8
63.7
62.1
84.8
ILE-337
ALA-338
15.1
15.1
2.1
-9.8
171.1
167.0
241.3

Graph shows rotational transition at bending residues and can be used
to identify hinge bending residues.
Probably only informative for interdomain rotations greater than 20 degrees
Residue
iResidue
i+1Distance of hinge axis to residue i in
(A) Distance of hinge axis to residue i in
(A) Change in
(deg) Change in
(deg) Angle of psi(i) axis to hinge axis
(deg) Angle of psi(i) axis to hinge axis
(deg) Percentage Progress
GLY-339
HIS-340
13.1
13.0
-7.7
3.1
63.1
63.8
109.5
HIS-340
LEU-341
10.5
10.4
2.3
-3.1
124.5
124.7
-43.9
LEU-341
ARG-342
8.0
8.0
-2.0
-0.3
55.7
55.4
103.3

Graph shows rotational transition at bending residues and can be used
to identify hinge bending residues.
Probably only informative for interdomain rotations greater than 20 degrees
Residue
iResidue
i+1Distance of hinge axis to residue i in
(A) Distance of hinge axis to residue i in
(A) Change in
(deg) Change in
(deg) Angle of psi(i) axis to hinge axis
(deg) Angle of psi(i) axis to hinge axis
(deg) Percentage Progress
THR-343
THR-344
2.3
2.3
2.0
-1.5
40.5
39.7
-37.2
THR-344
ILE-345
0.8
0.9
6.6
-8.4
109.1
110.1
106.7
ILE-345
GLY-346
3.7
3.7
-3.4
7.2
121.7
121.9
100.2

Graph shows rotational transition at bending residues and can be used
to identify hinge bending residues.
Probably only informative for interdomain rotations greater than 20 degrees