Hypothetical Transcriptional Regulator In Qaca 5'Region
(All numbering and residues are taken from first PDB file)
![]()
![]()
Bending Residue Dihedral Analysis
Residue
iResidue
i+1Distance of hinge axis to residue i in
(A) Distance of hinge axis to residue i in
(A) Change in
(deg) Change in
(deg) Angle of psi(i) axis to hinge axis
(deg) Angle of psi(i) axis to hinge axis
(deg) Percentage Progress
GLN-64
TRP-65
4.9
4.4
-6.6
-3.6
113.4
119.1
2.8
TRP-65
LYS-66
1.7
0.9
45.0
-23.2
30.9
40.3
47.2
LYS-66
LYS-67
1.5
2.4
-3.6
-3.5
139.5
150.6
-15.7
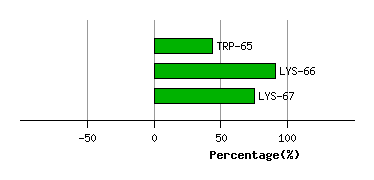
Graph shows rotational transition at bending residues and can be used
to identify hinge bending residues.
Probably only informative for interdomain rotations greater than 20 degrees
Residue
iResidue
i+1Distance of hinge axis to residue i in
(A) Distance of hinge axis to residue i in
(A) Change in
(deg) Change in
(deg) Angle of psi(i) axis to hinge axis
(deg) Angle of psi(i) axis to hinge axis
(deg) Percentage Progress
LEU-87
THR-88
12.4
11.4
-15.2
25.6
70.6
83.4
-7.9
THR-88
THR-89
12.5
12.1
-42.6
5.3
102.1
119.6
-43.7
THR-89
GLU-90
9.5
9.6
168.5
50.2
41.4
3.4
579.5
GLU-90
TYR-91
10.6
9.3
-9.4
45.2
122.1
111.2
74.3
TYR-91
TYR-92
7.3
13.0
170.4
-162.9
63.1
76.7
-960.3
TYR-92
TYR-93
4.8
13.6
74.6
-17.6
71.6
73.9
156.4
TYR-93
PRO-94
6.6
10.5
154.2
-4.8
54.9
26.1
340.8
PRO-94
LEU-95
9.7
12.1
4.1
25.2
13.1
39.5
79.3
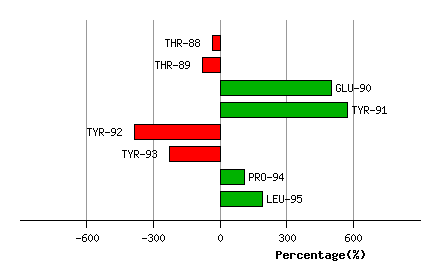
Graph shows rotational transition at bending residues and can be used
to identify hinge bending residues.
Probably only informative for interdomain rotations greater than 20 degrees
Residue
iResidue
i+1Distance of hinge axis to residue i in
(A) Distance of hinge axis to residue i in
(A) Change in
(deg) Change in
(deg) Angle of psi(i) axis to hinge axis
(deg) Angle of psi(i) axis to hinge axis
(deg) Percentage Progress
GLU-120
ASN-121
5.4
6.8
54.5
-35.5
37.6
41.1
45.9
ASN-121
LYS-122
8.3
9.5
1.1
-20.3
23.8
28.9
-53.9
LYS-122
TYR-123
6.2
7.7
28.0
-10.1
64.3
68.1
40.5

Graph shows rotational transition at bending residues and can be used
to identify hinge bending residues.
Probably only informative for interdomain rotations greater than 20 degrees