Creatine Kinase,m Chain
(All numbering and residues are taken from first PDB file)
![]()
![]()
Bending Residue Dihedral Analysis
Residue
iResidue
i+1Distance of hinge axis to residue i in
(A) Distance of hinge axis to residue i in
(A) Change in
(deg) Change in
(deg) Angle of psi(i) axis to hinge axis
(deg) Angle of psi(i) axis to hinge axis
(deg) Percentage Progress
HIS-106
LYS-107
4.4
4.4
11.6
-23.2
52.4
77.8
-14.9
LYS-107
THR-108
6.4
5.7
-0.5
-17.6
160.5
175.4
-247.2
THR-108
ASP-109
6.7
7.3
54.2
-4.5
58.4
86.4
-9.8

Graph shows rotational transition at bending residues and can be used
to identify hinge bending residues.
Probably only informative for interdomain rotations greater than 20 degrees
Residue
iResidue
i+1Distance of hinge axis to residue i in
(A) Distance of hinge axis to residue i in
(A) Change in
(deg) Change in
(deg) Angle of psi(i) axis to hinge axis
(deg) Angle of psi(i) axis to hinge axis
(deg) Percentage Progress
ARG-130
VAL-131
6.6
6.8
-11.8
-1.4
154.3
152.9
-101.7
VAL-131
ARG-132
3.9
4.1
15.0
-25.0
92.6
95.5
-31.8
ARG-132
THR-133
3.5
3.2
1.4
22.2
33.2
27.6
168.2

Graph shows rotational transition at bending residues and can be used
to identify hinge bending residues.
Probably only informative for interdomain rotations greater than 20 degrees
Residue
iResidue
i+1Distance of hinge axis to residue i in
(A) Distance of hinge axis to residue i in
(A) Change in
(deg) Change in
(deg) Angle of psi(i) axis to hinge axis
(deg) Angle of psi(i) axis to hinge axis
(deg) Percentage Progress
GLY-167
GLU-168
12.3
11.5
1.9
16.7
77.7
89.8
29.9
GLU-168
PHE-169
8.9
8.2
-10.5
1.7
64.3
69.4
-16.1
PHE-169
LYS-170
8.2
7.5
-23.4
30.6
123.8
124.5
33.6
LYS-170
GLY-171
9.3
8.9
14.8
-22.1
76.8
78.7
12.4

Graph shows rotational transition at bending residues and can be used
to identify hinge bending residues.
Probably only informative for interdomain rotations greater than 20 degrees
Residue
iResidue
i+1Distance of hinge axis to residue i in
(A) Distance of hinge axis to residue i in
(A) Change in
(deg) Change in
(deg) Angle of psi(i) axis to hinge axis
(deg) Angle of psi(i) axis to hinge axis
(deg) Percentage Progress
SER-239
MET-240
1.3
1.7
37.3
-40.2
83.7
83.7
-6.9
MET-240
GLU-241
4.7
5.1
-8.1
-12.2
147.2
151.9
-133.8
GLU-241
LYS-242
6.9
7.6
7.2
13.5
84.0
94.2
-33.8

Graph shows rotational transition at bending residues and can be used
to identify hinge bending residues.
Probably only informative for interdomain rotations greater than 20 degrees
Residue
iResidue
i+1Distance of hinge axis to residue i in
(A) Distance of hinge axis to residue i in
(A) Change in
(deg) Change in
(deg) Angle of psi(i) axis to hinge axis
(deg) Angle of psi(i) axis to hinge axis
(deg) Percentage Progress
CYS-254
VAL-255
7.3
6.6
-4.5
7.0
61.3
63.8
11.1
VAL-255
GLY-256
9.6
9.2
-5.0
-5.6
70.2
70.7
46.3
GLY-256
LEU-257
7.8
7.3
8.0
-3.2
43.5
43.8
33.5
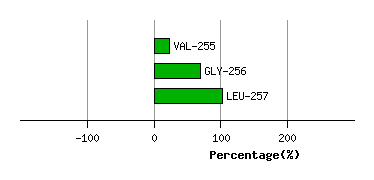
Graph shows rotational transition at bending residues and can be used
to identify hinge bending residues.
Probably only informative for interdomain rotations greater than 20 degrees
Residue
iResidue
i+1Distance of hinge axis to residue i in
(A) Distance of hinge axis to residue i in
(A) Change in
(deg) Change in
(deg) Angle of psi(i) axis to hinge axis
(deg) Angle of psi(i) axis to hinge axis
(deg) Percentage Progress
LEU-287
GLY-288
6.4
6.4
5.3
-9.4
89.9
87.0
-31.1
GLY-288
THR-289
3.3
3.6
-19.5
27.2
148.3
152.3
57.6
THR-289
GLY-290
1.7
2.2
-1.6
21.3
135.0
135.9
83.5

Graph shows rotational transition at bending residues and can be used
to identify hinge bending residues.
Probably only informative for interdomain rotations greater than 20 degrees