Rho-Associated Kinase
(All numbering and residues are taken from first PDB file)
![]()
![]()
Bending Residue Dihedral Analysis
Residue
iResidue
i+1Distance of hinge axis to residue i in
(A) Distance of hinge axis to residue i in
(A) Change in
(deg) Change in
(deg) Angle of psi(i) axis to hinge axis
(deg) Angle of psi(i) axis to hinge axis
(deg) Percentage Progress
SER-1012
ALA-1013
9.0
8.9
-29.8
13.1
46.9
43.7
22.5
ALA-1013
ALA-1014
7.9
8.0
-4.1
-9.1
72.4
66.5
24.7
ALA-1014
ALA-1015
6.8
6.8
13.5
-8.6
54.1
50.2
-11.7
ALA-1015
ILE-1016
4.8
5.2
19.0
-14.4
82.3
89.3
-0.4
ALA-1015
ILE-1016
4.8
5.2
19.0
-14.4
82.3
89.3
-0.4
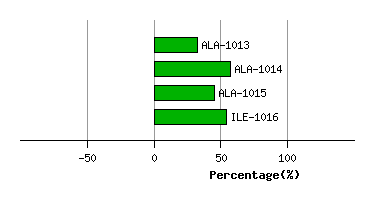
Graph shows rotational transition at bending residues and can be used
to identify hinge bending residues.
Probably only informative for interdomain rotations greater than 20 degrees
Residue
iResidue
i+1Distance of hinge axis to residue i in
(A) Distance of hinge axis to residue i in
(A) Change in
(deg) Change in
(deg) Angle of psi(i) axis to hinge axis
(deg) Angle of psi(i) axis to hinge axis
(deg) Percentage Progress
ALA-1015
ILE-1016
4.8
5.2
19.0
-14.4
82.3
89.3
-0.4
ALA-1015
ILE-1016
4.8
5.2
19.0
-14.4
82.3
89.3
-0.4
ILE-1016
LYS-1017
3.4
3.3
2.2
0.6
31.5
32.0
11.7
LYS-1017
ALA-1018
2.3
2.3
4.0
-10.4
100.8
102.1
-10.0
ALA-1018
GLN-1019
2.6
3.0
5.1
-2.5
60.2
56.2
7.5
ALA-1018
GLN-1019
2.6
3.0
5.1
-2.5
60.2
56.2
7.5

Graph shows rotational transition at bending residues and can be used
to identify hinge bending residues.
Probably only informative for interdomain rotations greater than 20 degrees
Residue
iResidue
i+1Distance of hinge axis to residue i in
(A) Distance of hinge axis to residue i in
(A) Change in
(deg) Change in
(deg) Angle of psi(i) axis to hinge axis
(deg) Angle of psi(i) axis to hinge axis
(deg) Percentage Progress
ALA-1018
GLN-1019
2.6
3.0
5.1
-2.5
60.2
56.2
7.5
ALA-1018
GLN-1019
2.6
3.0
5.1
-2.5
60.2
56.2
7.5
GLN-1019
PHE-1020
1.6
1.6
-9.7
11.7
52.2
54.4
15.4
PHE-1020
GLU-1021
3.2
3.0
-6.4
5.6
55.1
57.6
-5.3

Graph shows rotational transition at bending residues and can be used
to identify hinge bending residues.
Probably only informative for interdomain rotations greater than 20 degrees