Bifunctional P-450/nadph-P450 Reductase
(All numbering and residues are taken from first PDB file)
![]()
![]()
Bending Residue Dihedral Analysis
Residue
iResidue
i+1Distance of hinge axis to residue i in
(A) Distance of hinge axis to residue i in
(A) Change in
(deg) Change in
(deg) Angle of psi(i) axis to hinge axis
(deg) Angle of psi(i) axis to hinge axis
(deg) Percentage Progress
LEU-103
LEU-104
6.7
6.8
3.3
-9.0
123.0
118.6
72.5
LEU-104
PRO-105
8.6
9.0
-4.6
2.3
10.8
9.8
66.5
PRO-105
SER-106
8.4
8.7
-1.0
-12.1
73.5
74.6
5.5
SER-106
PHE-107
4.6
4.9
2.1
7.4
99.1
85.1
20.0
PHE-107
SER-108
6.5
6.2
-10.9
-9.4
51.3
59.2
16.4
SER-108
GLN-109
8.7
9.0
0.1
-2.7
131.5
133.7
-15.6
GLN-109
GLN-110
9.2
10.2
-1.6
9.6
54.2
39.6
5.8
GLN-110
ALA-111
6.7
8.5
-3.2
3.8
118.3
100.7
16.2
ALA-111
MET-112
4.1
5.1
11.7
8.9
95.4
100.2
-16.4
MET-112
LYS-113
5.6
6.1
6.2
1.9
153.9
153.7
-114.6
LYS-113
GLY-114
5.1
5.2
-4.2
-0.4
86.5
90.9
28.9
GLY-114
TYR-115
1.6
1.6
-9.4
1.2
127.4
123.0
-42.3
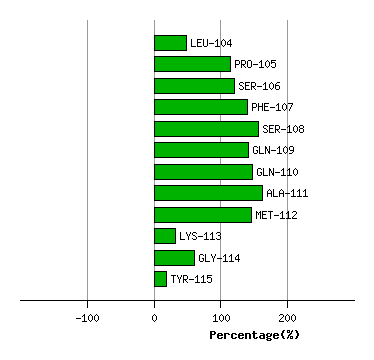
Graph shows rotational transition at bending residues and can be used
to identify hinge bending residues.
Probably only informative for interdomain rotations greater than 20 degrees
Residue
iResidue
i+1Distance of hinge axis to residue i in
(A) Distance of hinge axis to residue i in
(A) Change in
(deg) Change in
(deg) Angle of psi(i) axis to hinge axis
(deg) Angle of psi(i) axis to hinge axis
(deg) Percentage Progress
GLN-204
PHE-205
17.2
17.5
5.1
-7.2
122.5
117.6
29.3
PHE-205
GLN-206
13.5
13.6
0.7
5.0
110.5
107.5
-48.9
GLN-206
GLU-207
13.6
13.9
-2.0
-5.2
42.6
38.0
54.8
GLU-207
ASP-208
16.7
16.8
-1.2
9.5
31.6
28.3
-46.4
ASP-208
ILE-209
15.0
14.8
-4.2
4.7
67.5
72.2
-19.7
ILE-209
LYS-210
12.0
11.8
-7.3
-3.1
61.0
61.4
53.8
LYS-210
VAL-211
14.8
14.8
5.6
-11.7
154.6
155.2
15.3
VAL-211
MET-212
16.0
15.9
6.2
-3.3
130.5
132.0
-11.5
MET-212
ASN-213
12.5
12.4
-3.9
4.2
73.1
81.0
-1.4

Graph shows rotational transition at bending residues and can be used
to identify hinge bending residues.
Probably only informative for interdomain rotations greater than 20 degrees
Residue
iResidue
i+1Distance of hinge axis to residue i in
(A) Distance of hinge axis to residue i in
(A) Change in
(deg) Change in
(deg) Angle of psi(i) axis to hinge axis
(deg) Angle of psi(i) axis to hinge axis
(deg) Percentage Progress
ASP-232
LEU-233
4.0
4.2
-13.3
-2.4
23.2
32.9
117.6
LEU-233
LEU-234
3.1
3.1
6.5
-5.8
116.9
117.2
-56.4
LEU-234
THR-235
6.4
6.6
-1.1
-7.6
110.3
118.5
39.7
THR-235
HIS-236
8.5
8.4
13.6
-10.2
118.5
103.4
-13.0
HIS-236
MET-237
8.0
7.7
4.9
-7.0
166.2
159.0
77.2
MET-237
LEU-238
7.8
8.2
-1.2
13.6
81.6
87.9
-124.1
LEU-238
ASN-239
11.2
11.4
-2.5
20.7
107.7
118.5
36.6
ASN-239
GLY-240
13.0
12.8
9.6
-2.8
90.6
100.3
10.4
GLY-240
LYS-241
12.0
12.0
3.0
-8.4
137.0
133.8
8.6
LYS-241
ASP-242
14.8
14.8
1.0
-0.5
98.8
103.3
15.3

Graph shows rotational transition at bending residues and can be used
to identify hinge bending residues.
Probably only informative for interdomain rotations greater than 20 degrees