Iron Binding Protein Fbpa
(All numbering and residues are taken from first PDB file)
![]()
![]()
Bending Residue Dihedral Analysis
Residue
iResidue
i+1Distance of hinge axis to residue i in
(A) Distance of hinge axis to residue i in
(A) Change in
(deg) Change in
(deg) Angle of psi(i) axis to hinge axis
(deg) Angle of psi(i) axis to hinge axis
(deg) Percentage Progress
LEU-98
THR-99
5.1
5.2
5.4
1.2
13.9
16.0
23.3
THR-99
THR-100
3.0
3.0
0.2
-6.6
93.4
93.4
28.9
THR-100
ARG-101
1.0
1.5
-4.5
20.2
141.8
138.5
46.7
ARG-101
ALA-102
2.9
3.2
-17.8
13.8
97.1
100.0
11.8

Graph shows rotational transition at bending residues and can be used
to identify hinge bending residues.
Probably only informative for interdomain rotations greater than 20 degrees
Residue
iResidue
i+1Distance of hinge axis to residue i in
(A) Distance of hinge axis to residue i in
(A) Change in
(deg) Change in
(deg) Angle of psi(i) axis to hinge axis
(deg) Angle of psi(i) axis to hinge axis
(deg) Percentage Progress
LYS-229
ASN-230
7.2
7.1
-5.6
28.2
153.0
154.1
79.1
ASN-230
ILE-231
5.4
5.5
3.3
-5.6
91.3
89.5
12.7
ILE-231
SER-232
1.9
1.9
6.7
-18.6
75.8
77.5
-13.4
SER-232
GLY-233
3.5
2.6
14.3
-27.8
43.6
52.9
-68.8
GLY-233
VAL-234
3.1
3.1
15.7
11.2
54.9
45.7
102.6

Graph shows rotational transition at bending residues and can be used
to identify hinge bending residues.
Probably only informative for interdomain rotations greater than 20 degrees
Residue
iResidue
i+1Distance of hinge axis to residue i in
(A) Distance of hinge axis to residue i in
(A) Change in
(deg) Change in
(deg) Angle of psi(i) axis to hinge axis
(deg) Angle of psi(i) axis to hinge axis
(deg) Percentage Progress
LEU-265
ASN-266
11.2
9.9
6.8
-7.4
102.7
99.9
9.8
ASN-266
HIS-267
8.6
7.5
25.5
-8.1
58.6
54.7
36.6
HIS-267
GLU-268
5.5
5.0
2.1
-14.7
129.2
120.7
4.7
GLU-268
TYR-269
3.4
2.3
16.0
-15.9
84.2
78.9
-0.1
TYR-269
PRO-270
2.9
3.0
22.2
1.5
142.7
141.6
-72.1
PRO-270
VAL-271
6.0
6.1
-1.9
4.3
59.5
58.1
7.7

Graph shows rotational transition at bending residues and can be used
to identify hinge bending residues.
Probably only informative for interdomain rotations greater than 20 degrees
Residue
iResidue
i+1Distance of hinge axis to residue i in
(A) Distance of hinge axis to residue i in
(A) Change in
(deg) Change in
(deg) Angle of psi(i) axis to hinge axis
(deg) Angle of psi(i) axis to hinge axis
(deg) Percentage Progress
LYS-282
GLY-283
4.1
4.0
1.1
-0.8
38.8
34.3
2.6
GLY-283
TRP-284
2.1
2.2
3.1
-0.7
100.1
96.1
-0.2
TRP-284
GLY-285
3.0
2.9
-3.4
44.4
86.1
88.1
8.5
GLY-285
THR-286
5.9
6.0
-21.3
-10.6
17.8
31.7
108.6
THR-286
PHE-287
8.3
8.5
-18.8
-0.4
81.3
75.5
-37.1
PHE-287
LYS-288
10.1
10.6
-0.3
-7.0
33.9
31.1
33.0
LYS-288
SER-289
12.6
12.8
6.0
-3.3
140.5
136.5
-15.8
SER-289
ASP-290
10.9
11.0
7.2
-4.0
130.5
133.6
-10.4
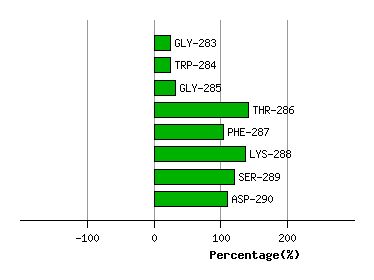
Graph shows rotational transition at bending residues and can be used
to identify hinge bending residues.
Probably only informative for interdomain rotations greater than 20 degrees