Renin
(All numbering and residues are taken from first PDB file)
![]()
![]()
Bending Residue Dihedral Analysis
Residue
iResidue
i+1Distance of hinge axis to residue i in
(A) Distance of hinge axis to residue i in
(A) Change in
(deg) Change in
(deg) Angle of psi(i) axis to hinge axis
(deg) Angle of psi(i) axis to hinge axis
(deg) Percentage Progress
LYS-199
GLY-200
9.6
9.4
15.6
-18.1
97.6
93.2
-9.7
GLY-200
VAL-201
5.9
5.7
0.2
8.2
29.8
29.6
65.4
VAL-201
SER-202
3.1
3.1
-2.2
6.6
73.4
74.5
-12.1

Graph shows rotational transition at bending residues and can be used
to identify hinge bending residues.
Probably only informative for interdomain rotations greater than 20 degrees
Residue
iResidue
i+1Distance of hinge axis to residue i in
(A) Distance of hinge axis to residue i in
(A) Change in
(deg) Change in
(deg) Angle of psi(i) axis to hinge axis
(deg) Angle of psi(i) axis to hinge axis
(deg) Percentage Progress
LEU-208
LEU-209
2.0
2.1
-20.6
1.5
68.2
76.0
46.4
LEU-209
CYS-210
2.4
2.2
-0.2
4.9
99.5
98.8
-0.9
CYS-210
GLU-211
5.4
5.2
-16.0
9.1
145.1
140.0
-64.9
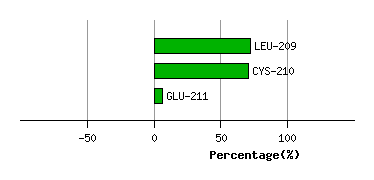
Graph shows rotational transition at bending residues and can be used
to identify hinge bending residues.
Probably only informative for interdomain rotations greater than 20 degrees
Residue
iResidue
i+1Distance of hinge axis to residue i in
(A) Distance of hinge axis to residue i in
(A) Change in
(deg) Change in
(deg) Angle of psi(i) axis to hinge axis
(deg) Angle of psi(i) axis to hinge axis
(deg) Percentage Progress
GLU-233
LYS-234
10.9
10.4
-0.4
2.2
61.2
55.5
-1.5
LYS-234
LEU-235
8.5
8.2
-2.1
-0.3
125.8
121.7
-7.1
LEU-235
MET-236
6.0
5.6
3.2
2.5
54.2
55.4
41.4

Graph shows rotational transition at bending residues and can be used
to identify hinge bending residues.
Probably only informative for interdomain rotations greater than 20 degrees
Residue
iResidue
i+1Distance of hinge axis to residue i in
(A) Distance of hinge axis to residue i in
(A) Change in
(deg) Change in
(deg) Angle of psi(i) axis to hinge axis
(deg) Angle of psi(i) axis to hinge axis
(deg) Percentage Progress
ASP-260
ILE-261
7.5
8.2
-0.4
9.5
122.6
122.2
24.3
ILE-261
SER-262
4.1
4.8
3.6
-0.5
87.9
83.8
11.4
SER-262
PHE-263
5.7
6.3
-7.8
4.4
112.7
111.2
4.9

Graph shows rotational transition at bending residues and can be used
to identify hinge bending residues.
Probably only informative for interdomain rotations greater than 20 degrees
Residue
iResidue
i+1Distance of hinge axis to residue i in
(A) Distance of hinge axis to residue i in
(A) Change in
(deg) Change in
(deg) Angle of psi(i) axis to hinge axis
(deg) Angle of psi(i) axis to hinge axis
(deg) Percentage Progress
TYR-277
VAL-278
2.3
2.9
-0.7
4.4
111.4
109.5
22.7
VAL-278
PHE-279
5.2
5.5
-10.3
5.3
178.3
178.2
-38.2
PHE-279
GLN-280
5.5
5.4
-3.8
0.4
102.2
109.3
-14.3

Graph shows rotational transition at bending residues and can be used
to identify hinge bending residues.
Probably only informative for interdomain rotations greater than 20 degrees
Residue
iResidue
i+1Distance of hinge axis to residue i in
(A) Distance of hinge axis to residue i in
(A) Change in
(deg) Change in
(deg) Angle of psi(i) axis to hinge axis
(deg) Angle of psi(i) axis to hinge axis
(deg) Percentage Progress
THR-290
LEU-291
9.0
8.6
9.3
-1.4
65.4
65.4
35.3
LEU-291
ALA-292
6.1
5.6
16.2
-14.2
97.5
105.3
-8.9
ALA-292
ILE-293
3.8
2.9
-2.1
-2.2
149.1
144.6
-37.0

Graph shows rotational transition at bending residues and can be used
to identify hinge bending residues.
Probably only informative for interdomain rotations greater than 20 degrees