Igm-Kappa Cold Agglutinin (Light Chain)
(All numbering and residues are taken from first PDB file)
![]()
![]()
Bending Residue Dihedral Analysis
Residue
iResidue
i+1Distance of hinge axis to residue i in
(A) Distance of hinge axis to residue i in
(A) Change in
(deg) Change in
(deg) Angle of psi(i) axis to hinge axis
(deg) Angle of psi(i) axis to hinge axis
(deg) Percentage Progress
ILE-107
LYS-108
14.2
14.2
2.8
1.4
155.9
154.4
-121.3
LYS-108
ARG-109
16.3
16.4
3.0
0.7
123.6
128.4
76.3
ARG-109
THR-110
16.1
16.2
8.4
-18.3
157.9
150.5
53.6

Graph shows rotational transition at bending residues and can be used
to identify hinge bending residues.
Probably only informative for interdomain rotations greater than 20 degrees
Residue
iResidue
i+1Distance of hinge axis to residue i in
(A) Distance of hinge axis to residue i in
(A) Change in
(deg) Change in
(deg) Angle of psi(i) axis to hinge axis
(deg) Angle of psi(i) axis to hinge axis
(deg) Percentage Progress
CYS-135
LEU-136
8.5
8.8
11.0
-15.4
134.9
136.2
199.6
LEU-136
LEU-137
5.1
5.4
-28.0
15.1
110.8
102.9
-32.4
LEU-137
ASN-138
3.6
3.6
3.7
-2.0
124.1
127.0
-388.5
ASN-138
ASN-139
1.5
1.6
12.0
7.9
95.0
88.7
107.4
ASN-139
PHE-140
4.8
4.9
-2.2
-1.6
107.8
105.6
89.9
ASN-139
PHE-140
4.8
4.9
-2.2
-1.6
107.8
105.6
89.9

Graph shows rotational transition at bending residues and can be used
to identify hinge bending residues.
Probably only informative for interdomain rotations greater than 20 degrees
Residue
iResidue
i+1Distance of hinge axis to residue i in
(A) Distance of hinge axis to residue i in
(A) Change in
(deg) Change in
(deg) Angle of psi(i) axis to hinge axis
(deg) Angle of psi(i) axis to hinge axis
(deg) Percentage Progress
ASN-139
PHE-140
4.8
4.9
-2.2
-1.6
107.8
105.6
89.9
ASN-139
PHE-140
4.8
4.9
-2.2
-1.6
107.8
105.6
89.9
PHE-140
TYR-141
7.4
7.4
-4.7
5.6
38.4
40.0
-46.6
TYR-141
PRO-142
10.7
10.8
3.9
1.6
61.0
62.0
-4.6

Graph shows rotational transition at bending residues and can be used
to identify hinge bending residues.
Probably only informative for interdomain rotations greater than 20 degrees
Residue
iResidue
i+1Distance of hinge axis to residue i in
(A) Distance of hinge axis to residue i in
(A) Change in
(deg) Change in
(deg) Angle of psi(i) axis to hinge axis
(deg) Angle of psi(i) axis to hinge axis
(deg) Percentage Progress
ARG-143
GLU-144
10.6
10.7
3.0
-1.0
117.8
116.7
-64.3
GLU-144
ALA-145
13.1
13.1
9.8
-15.3
158.8
158.0
143.2
ALA-145
LYS-146
11.9
12.0
-15.4
26.3
85.0
86.5
-128.2
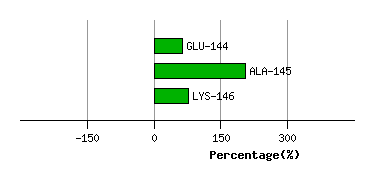
Graph shows rotational transition at bending residues and can be used
to identify hinge bending residues.
Probably only informative for interdomain rotations greater than 20 degrees
Residue
iResidue
i+1Distance of hinge axis to residue i in
(A) Distance of hinge axis to residue i in
(A) Change in
(deg) Change in
(deg) Angle of psi(i) axis to hinge axis
(deg) Angle of psi(i) axis to hinge axis
(deg) Percentage Progress
SER-160
GLN-161
17.6
17.3
-0.8
7.7
26.8
27.1
-276.8
GLN-161
GLU-162
15.2
15.0
-12.6
23.8
104.0
100.4
-56.4
GLU-162
SER-163
11.7
11.7
-0.1
-3.4
27.6
28.9
120.7
SER-163
VAL-164
8.9
8.8
-14.9
6.3
106.6
102.5
68.7
VAL-164
THR-165
6.0
6.1
0.0
-6.0
134.2
130.3
133.5
THR-165
GLU-166
2.6
2.6
11.1
-14.8
122.4
122.7
123.7

Graph shows rotational transition at bending residues and can be used
to identify hinge bending residues.
Probably only informative for interdomain rotations greater than 20 degrees
Residue
iResidue
i+1Distance of hinge axis to residue i in
(A) Distance of hinge axis to residue i in
(A) Change in
(deg) Change in
(deg) Angle of psi(i) axis to hinge axis
(deg) Angle of psi(i) axis to hinge axis
(deg) Percentage Progress
SER-175
LEU-176
2.5
2.3
-3.8
-2.2
106.6
104.5
-1.7
LEU-176
SER-177
5.1
5.1
-0.4
-8.3
59.8
56.7
83.1
SER-177
SER-178
7.2
7.2
3.6
-0.2
93.5
91.9
-34.2

Graph shows rotational transition at bending residues and can be used
to identify hinge bending residues.
Probably only informative for interdomain rotations greater than 20 degrees
Residue
iResidue
i+1Distance of hinge axis to residue i in
(A) Distance of hinge axis to residue i in
(A) Change in
(deg) Change in
(deg) Angle of psi(i) axis to hinge axis
(deg) Angle of psi(i) axis to hinge axis
(deg) Percentage Progress
ALA-194
CYS-195
13.1
13.3
4.1
-8.8
148.1
149.3
224.2
CYS-195
GLU-196
11.3
11.4
-7.7
9.2
106.2
104.8
-290.3
GLU-196
VAL-197
11.9
11.9
5.5
-11.6
140.5
140.2
98.7
VAL-197
THR-198
10.6
10.8
-1.2
7.0
101.2
96.3
230.4
THR-198
HIS-199
12.9
13.1
3.8
7.9
142.5
142.4
-407.0

Graph shows rotational transition at bending residues and can be used
to identify hinge bending residues.
Probably only informative for interdomain rotations greater than 20 degrees
Residue
iResidue
i+1Distance of hinge axis to residue i in
(A) Distance of hinge axis to residue i in
(A) Change in
(deg) Change in
(deg) Angle of psi(i) axis to hinge axis
(deg) Angle of psi(i) axis to hinge axis
(deg) Percentage Progress
PRO-205
VAL-206
12.6
12.7
-1.6
-3.4
122.1
122.8
-159.3
VAL-206
THR-207
9.1
9.2
17.4
-21.8
97.6
95.2
-67.9
THR-207
LYS-208
9.5
9.2
11.5
-18.5
77.0
75.4
49.6
LYS-208
SER-209
7.5
7.7
1.1
-4.1
84.6
88.8
-28.6

Graph shows rotational transition at bending residues and can be used
to identify hinge bending residues.
Probably only informative for interdomain rotations greater than 20 degrees