Phosphoenolpyruvate Carboxykinase
(All numbering and residues are taken from first PDB file)
![]()
![]()
Bending Residue Dihedral Analysis
Residue
iResidue
i+1Distance of hinge axis to residue i in
(A) Distance of hinge axis to residue i in
(A) Change in
(deg) Change in
(deg) Angle of psi(i) axis to hinge axis
(deg) Angle of psi(i) axis to hinge axis
(deg) Percentage Progress
ALA-235
ASN-236
3.8
4.7
9.0
-9.1
155.2
157.4
-2.6
ASN-236
VAL-237
4.1
4.9
-1.4
2.7
50.1
55.0
7.9
VAL-237
GLY-238
2.3
2.9
3.1
0.6
133.4
132.6
-11.9

Graph shows rotational transition at bending residues and can be used
to identify hinge bending residues.
Probably only informative for interdomain rotations greater than 20 degrees
Residue
iResidue
i+1Distance of hinge axis to residue i in
(A) Distance of hinge axis to residue i in
(A) Change in
(deg) Change in
(deg) Angle of psi(i) axis to hinge axis
(deg) Angle of psi(i) axis to hinge axis
(deg) Percentage Progress
GLY-251
SER-252
14.2
14.1
20.4
-12.5
58.2
71.3
0.3
SER-252
GLY-253
11.9
11.9
5.8
30.5
15.9
12.1
199.9
GLY-253
LYS-254
13.0
12.4
-9.9
-7.1
128.7
130.9
-64.4
LYS-254
THR-255
9.6
9.6
15.0
-22.5
144.3
139.3
27.3
LYS-254
THR-255
9.6
9.6
15.0
-22.5
144.3
139.3
27.3

Graph shows rotational transition at bending residues and can be used
to identify hinge bending residues.
Probably only informative for interdomain rotations greater than 20 degrees
Residue
iResidue
i+1Distance of hinge axis to residue i in
(A) Distance of hinge axis to residue i in
(A) Change in
(deg) Change in
(deg) Angle of psi(i) axis to hinge axis
(deg) Angle of psi(i) axis to hinge axis
(deg) Percentage Progress
LYS-254
THR-255
9.6
9.6
15.0
-22.5
144.3
139.3
27.3
LYS-254
THR-255
9.6
9.6
15.0
-22.5
144.3
139.3
27.3
THR-255
THR-256
11.6
12.4
4.9
-1.2
135.3
123.9
-24.2
THR-256
LEU-257
13.9
14.6
1.7
-9.0
123.7
127.8
33.5

Graph shows rotational transition at bending residues and can be used
to identify hinge bending residues.
Probably only informative for interdomain rotations greater than 20 degrees
Residue
iResidue
i+1Distance of hinge axis to residue i in
(A) Distance of hinge axis to residue i in
(A) Change in
(deg) Change in
(deg) Angle of psi(i) axis to hinge axis
(deg) Angle of psi(i) axis to hinge axis
(deg) Percentage Progress
ARG-263
ARG-264
7.1
8.3
31.1
-12.1
103.8
93.6
-23.3
ARG-264
LEU-265
7.3
7.8
-20.5
10.9
22.1
22.8
49.6
LEU-265
ILE-266
8.1
8.8
0.4
-8.3
91.4
92.3
-21.0
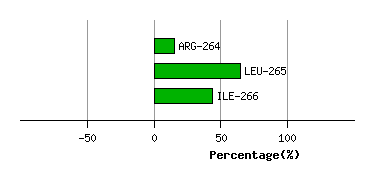
Graph shows rotational transition at bending residues and can be used
to identify hinge bending residues.
Probably only informative for interdomain rotations greater than 20 degrees
Residue
iResidue
i+1Distance of hinge axis to residue i in
(A) Distance of hinge axis to residue i in
(A) Change in
(deg) Change in
(deg) Angle of psi(i) axis to hinge axis
(deg) Angle of psi(i) axis to hinge axis
(deg) Percentage Progress
THR-355
LYS-356
7.3
6.7
-2.3
10.1
124.2
122.8
31.4
LYS-356
VAL-357
6.6
6.2
-3.5
-2.1
139.2
139.7
-28.2
VAL-357
ILE-358
5.3
4.9
-7.1
6.3
117.1
120.1
10.8

Graph shows rotational transition at bending residues and can be used
to identify hinge bending residues.
Probably only informative for interdomain rotations greater than 20 degrees
Residue
iResidue
i+1Distance of hinge axis to residue i in
(A) Distance of hinge axis to residue i in
(A) Change in
(deg) Change in
(deg) Angle of psi(i) axis to hinge axis
(deg) Angle of psi(i) axis to hinge axis
(deg) Percentage Progress
SER-406
ALA-407
2.8
3.2
-3.0
3.5
119.7
128.7
-1.4
ALA-407
CYS-408
1.3
1.2
2.9
8.2
23.2
23.9
54.0
CYS-408
PHE-409
2.0
1.8
-6.0
0.7
115.1
114.1
-8.9

Graph shows rotational transition at bending residues and can be used
to identify hinge bending residues.
Probably only informative for interdomain rotations greater than 20 degrees
Residue
iResidue
i+1Distance of hinge axis to residue i in
(A) Distance of hinge axis to residue i in
(A) Change in
(deg) Change in
(deg) Angle of psi(i) axis to hinge axis
(deg) Angle of psi(i) axis to hinge axis
(deg) Percentage Progress
GLY-433
ALA-434
13.4
12.6
5.3
1.2
81.0
80.7
8.9
ALA-434
GLN-435
10.2
9.5
-2.4
1.1
129.1
126.3
5.8
GLN-435
ALA-436
11.0
10.4
6.9
-4.0
55.8
56.1
18.7

Graph shows rotational transition at bending residues and can be used
to identify hinge bending residues.
Probably only informative for interdomain rotations greater than 20 degrees