Glutamyl-Trna Synthetase
(All numbering and residues are taken from first PDB file)
![]()
![]()
Bending Residue Dihedral Analysis
Residue
iResidue
i+1Distance of hinge axis to residue i in
(A) Distance of hinge axis to residue i in
(A) Change in
(deg) Change in
(deg) Angle of psi(i) axis to hinge axis
(deg) Angle of psi(i) axis to hinge axis
(deg) Percentage Progress
THR-11
GLY-12
19.6
19.9
-10.9
-9.3
54.7
44.5
126.3
GLY-12
ASP-13
18.8
18.9
3.3
13.1
142.8
130.0
-1.2
ASP-13
PRO-14
16.7
16.5
-24.6
12.3
106.0
104.2
-17.8
PRO-14
HIS-15
13.9
13.6
3.2
-9.5
97.0
99.0
26.1
PRO-14
HIS-15
13.9
13.6
3.2
-9.5
97.0
99.0
26.1

Graph shows rotational transition at bending residues and can be used
to identify hinge bending residues.
Probably only informative for interdomain rotations greater than 20 degrees
Residue
iResidue
i+1Distance of hinge axis to residue i in
(A) Distance of hinge axis to residue i in
(A) Change in
(deg) Change in
(deg) Angle of psi(i) axis to hinge axis
(deg) Angle of psi(i) axis to hinge axis
(deg) Percentage Progress
PRO-14
HIS-15
13.9
13.6
3.2
-9.5
97.0
99.0
26.1
PRO-14
HIS-15
13.9
13.6
3.2
-9.5
97.0
99.0
26.1
HIS-15
VAL-16
11.1
10.9
-2.7
7.3
105.8
106.0
4.3
VAL-16
GLY-17
7.5
7.4
2.0
7.4
140.4
144.0
-65.7
GLY-17
THR-18
6.2
6.6
-11.1
-6.7
101.2
100.9
-27.4
GLY-17
THR-18
6.2
6.6
-11.1
-6.7
101.2
100.9
-27.4

Graph shows rotational transition at bending residues and can be used
to identify hinge bending residues.
Probably only informative for interdomain rotations greater than 20 degrees
Residue
iResidue
i+1Distance of hinge axis to residue i in
(A) Distance of hinge axis to residue i in
(A) Change in
(deg) Change in
(deg) Angle of psi(i) axis to hinge axis
(deg) Angle of psi(i) axis to hinge axis
(deg) Percentage Progress
GLY-17
THR-18
6.2
6.6
-11.1
-6.7
101.2
100.9
-27.4
GLY-17
THR-18
6.2
6.6
-11.1
-6.7
101.2
100.9
-27.4
THR-18
ALA-19
8.3
8.4
6.6
1.7
127.4
129.0
-91.1
ALA-19
TYR-20
7.1
7.1
-1.4
-10.6
111.0
114.6
7.6
TYR-20
ILE-21
3.8
4.0
-4.4
6.2
129.3
141.6
55.1

Graph shows rotational transition at bending residues and can be used
to identify hinge bending residues.
Probably only informative for interdomain rotations greater than 20 degrees
Residue
iResidue
i+1Distance of hinge axis to residue i in
(A) Distance of hinge axis to residue i in
(A) Change in
(deg) Change in
(deg) Angle of psi(i) axis to hinge axis
(deg) Angle of psi(i) axis to hinge axis
(deg) Percentage Progress
THR-156
GLU-157
5.6
5.6
-3.1
-17.8
46.1
46.0
84.5
GLU-157
VAL-158
7.3
6.9
-6.6
4.6
25.1
25.8
31.2
VAL-158
LYS-159
6.8
6.6
0.0
11.1
128.1
130.8
-81.9
LYS-159
ASP-160
8.8
8.5
19.9
-26.1
167.3
157.0
78.9
ASP-160
GLU-161
7.8
7.2
-5.6
5.5
66.2
59.9
-44.4
GLU-161
LEU-162
10.8
10.0
3.0
-16.3
117.5
117.9
-46.9

Graph shows rotational transition at bending residues and can be used
to identify hinge bending residues.
Probably only informative for interdomain rotations greater than 20 degrees
Residue
iResidue
i+1Distance of hinge axis to residue i in
(A) Distance of hinge axis to residue i in
(A) Change in
(deg) Change in
(deg) Angle of psi(i) axis to hinge axis
(deg) Angle of psi(i) axis to hinge axis
(deg) Percentage Progress
ARG-163
GLY-164
8.8
7.9
20.7
-24.3
146.5
152.5
5.9
GLY-164
VAL-165
10.5
9.7
-16.9
10.9
41.3
42.2
-20.5
VAL-165
VAL-166
9.4
8.7
18.4
-14.7
108.6
114.0
74.6
VAL-166
VAL-167
6.0
5.9
57.0
-41.8
147.8
151.3
-121.2
VAL-167
TYR-168
5.4
5.2
-10.3
5.5
82.3
76.9
-33.0
TYR-168
ASP-169
1.8
1.7
-24.8
18.5
15.6
14.8
99.1

Graph shows rotational transition at bending residues and can be used
to identify hinge bending residues.
Probably only informative for interdomain rotations greater than 20 degrees
Residue
iResidue
i+1Distance of hinge axis to residue i in
(A) Distance of hinge axis to residue i in
(A) Change in
(deg) Change in
(deg) Angle of psi(i) axis to hinge axis
(deg) Angle of psi(i) axis to hinge axis
(deg) Percentage Progress
ASP-202
VAL-203
13.9
13.5
16.0
-8.1
98.1
101.6
-1.1
VAL-203
ILE-204
11.1
10.6
5.6
-9.3
111.8
115.0
34.7
ILE-204
ARG-205
8.3
7.9
-0.1
-6.4
81.3
81.1
28.1

Graph shows rotational transition at bending residues and can be used
to identify hinge bending residues.
Probably only informative for interdomain rotations greater than 20 degrees
Residue
iResidue
i+1Distance of hinge axis to residue i in
(A) Distance of hinge axis to residue i in
(A) Change in
(deg) Change in
(deg) Angle of psi(i) axis to hinge axis
(deg) Angle of psi(i) axis to hinge axis
(deg) Percentage Progress
LEU-210
VAL-211
2.0
2.0
1.5
5.9
165.7
167.7
-100.3
VAL-211
SER-212
3.0
3.4
-20.1
-0.1
71.1
58.0
133.6
SER-212
THR-213
6.2
6.2
8.5
0.0
98.5
95.3
63.9
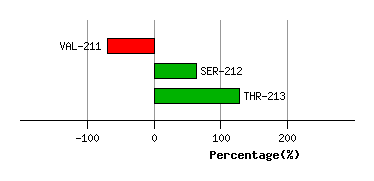
Graph shows rotational transition at bending residues and can be used
to identify hinge bending residues.
Probably only informative for interdomain rotations greater than 20 degrees
Residue
iResidue
i+1Distance of hinge axis to residue i in
(A) Distance of hinge axis to residue i in
(A) Change in
(deg) Change in
(deg) Angle of psi(i) axis to hinge axis
(deg) Angle of psi(i) axis to hinge axis
(deg) Percentage Progress
THR-251
SER-252
11.1
11.1
22.9
-15.9
112.6
104.8
9.1
SER-252
LEU-253
12.6
12.4
0.3
0.1
140.2
132.4
-14.5
LEU-253
ASP-254
10.6
10.4
-9.5
3.5
33.3
30.9
109.7
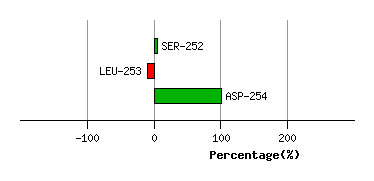
Graph shows rotational transition at bending residues and can be used
to identify hinge bending residues.
Probably only informative for interdomain rotations greater than 20 degrees
Residue
iResidue
i+1Distance of hinge axis to residue i in
(A) Distance of hinge axis to residue i in
(A) Change in
(deg) Change in
(deg) Angle of psi(i) axis to hinge axis
(deg) Angle of psi(i) axis to hinge axis
(deg) Percentage Progress
ALA-265
LEU-266
1.6
2.0
7.6
-4.6
156.9
151.6
-37.8
LEU-266
ARG-267
1.7
2.0
-3.8
8.7
45.2
44.7
-7.6
ARG-267
ASN-268
3.7
4.1
-3.0
-0.4
83.2
81.6
19.7
ASN-268
TYR-269
4.3
4.6
6.9
-17.7
61.6
58.3
-102.5
ASN-268
TYR-269
4.3
4.6
6.9
-17.7
61.6
58.3
-102.5

Graph shows rotational transition at bending residues and can be used
to identify hinge bending residues.
Probably only informative for interdomain rotations greater than 20 degrees
Residue
iResidue
i+1Distance of hinge axis to residue i in
(A) Distance of hinge axis to residue i in
(A) Change in
(deg) Change in
(deg) Angle of psi(i) axis to hinge axis
(deg) Angle of psi(i) axis to hinge axis
(deg) Percentage Progress
ASN-268
TYR-269
4.3
4.6
6.9
-17.7
61.6
58.3
-102.5
ASN-268
TYR-269
4.3
4.6
6.9
-17.7
61.6
58.3
-102.5
TYR-269
LEU-270
2.6
2.5
14.2
-6.9
10.1
14.2
108.0
LEU-270
CYS-271
1.2
1.3
-2.0
5.5
116.5
113.7
45.9

Graph shows rotational transition at bending residues and can be used
to identify hinge bending residues.
Probably only informative for interdomain rotations greater than 20 degrees
Residue
iResidue
i+1Distance of hinge axis to residue i in
(A) Distance of hinge axis to residue i in
(A) Change in
(deg) Change in
(deg) Angle of psi(i) axis to hinge axis
(deg) Angle of psi(i) axis to hinge axis
(deg) Percentage Progress
MET-273
GLY-274
4.5
4.3
33.6
-75.3
144.0
135.7
252.0
GLY-274
PHE-275
6.7
6.7
149.0
-122.2
75.2
80.1
-123.3
PHE-275
SER-276
8.9
9.1
-40.6
35.5
137.4
141.3
-101.7
SER-276
MET-277
11.8
12.1
0.6
-5.1
73.9
75.2
11.9

Graph shows rotational transition at bending residues and can be used
to identify hinge bending residues.
Probably only informative for interdomain rotations greater than 20 degrees
Residue
iResidue
i+1Distance of hinge axis to residue i in
(A) Distance of hinge axis to residue i in
(A) Change in
(deg) Change in
(deg) Angle of psi(i) axis to hinge axis
(deg) Angle of psi(i) axis to hinge axis
(deg) Percentage Progress
GLY-280
ARG-281
16.2
16.3
4.9
-2.8
144.0
135.7
-13.4
ARG-281
GLU-282
14.4
14.0
4.5
-17.2
73.0
75.3
50.7
GLU-282
ILE-283
10.8
10.3
25.2
-22.8
121.4
127.1
30.9
ILE-283
PHE-284
9.5
9.4
10.1
-74.6
84.3
86.0
-303.4

Graph shows rotational transition at bending residues and can be used
to identify hinge bending residues.
Probably only informative for interdomain rotations greater than 20 degrees
Residue
iResidue
i+1Distance of hinge axis to residue i in
(A) Distance of hinge axis to residue i in
(A) Change in
(deg) Change in
(deg) Angle of psi(i) axis to hinge axis
(deg) Angle of psi(i) axis to hinge axis
(deg) Percentage Progress
GLN-291
ALA-292
17.0
17.2
18.2
-0.2
60.7
72.5
136.2
ALA-292
PHE-293
16.1
16.1
-25.2
20.6
151.8
156.8
-13.3
PHE-293
THR-294
14.0
13.9
-22.5
10.2
145.0
149.9
-180.1
THR-294
TRP-295
14.9
14.5
-3.1
11.2
56.4
56.5
-122.2
THR-294
TRP-295
14.9
14.5
-3.1
11.2
56.4
56.5
-122.2

Graph shows rotational transition at bending residues and can be used
to identify hinge bending residues.
Probably only informative for interdomain rotations greater than 20 degrees
Residue
iResidue
i+1Distance of hinge axis to residue i in
(A) Distance of hinge axis to residue i in
(A) Change in
(deg) Change in
(deg) Angle of psi(i) axis to hinge axis
(deg) Angle of psi(i) axis to hinge axis
(deg) Percentage Progress
THR-294
TRP-295
14.9
14.5
-3.1
11.2
56.4
56.5
-122.2
THR-294
TRP-295
14.9
14.5
-3.1
11.2
56.4
56.5
-122.2
TRP-295
GLU-296
12.8
12.3
-5.1
20.6
82.5
87.2
14.6
GLU-296
ARG-297
15.1
14.6
-38.2
17.1
135.2
121.5
-78.5
ARG-297
VAL-298
13.6
13.1
18.8
-4.1
89.5
88.4
63.2
VAL-298
SER-299
10.0
9.4
2.1
10.5
124.3
124.0
-113.4

Graph shows rotational transition at bending residues and can be used
to identify hinge bending residues.
Probably only informative for interdomain rotations greater than 20 degrees
Residue
iResidue
i+1Distance of hinge axis to residue i in
(A) Distance of hinge axis to residue i in
(A) Change in
(deg) Change in
(deg) Angle of psi(i) axis to hinge axis
(deg) Angle of psi(i) axis to hinge axis
(deg) Percentage Progress
VAL-304
PHE-305
9.5
8.8
1.2
-23.7
155.8
152.0
82.5
PHE-305
ASP-306
7.8
7.3
-32.1
0.1
45.9
50.3
158.7
ASP-306
LEU-307
9.6
9.5
22.0
-17.6
148.0
148.1
-91.9

Graph shows rotational transition at bending residues and can be used
to identify hinge bending residues.
Probably only informative for interdomain rotations greater than 20 degrees
Residue
iResidue
i+1Distance of hinge axis to residue i in
(A) Distance of hinge axis to residue i in
(A) Change in
(deg) Change in
(deg) Angle of psi(i) axis to hinge axis
(deg) Angle of psi(i) axis to hinge axis
(deg) Percentage Progress
MET-313
ASN-314
5.1
5.1
12.0
-11.4
45.3
49.8
34.0
ASN-314
GLY-315
2.7
2.3
4.7
-9.0
20.8
17.8
-20.4
GLY-315
LYS-316
4.8
4.5
17.0
-13.1
76.8
80.5
49.2
LYS-316
TYR-317
6.0
5.9
4.2
-3.7
99.6
102.4
18.5
LYS-316
TYR-317
6.0
5.9
4.2
-3.7
99.6
102.4
18.5

Graph shows rotational transition at bending residues and can be used
to identify hinge bending residues.
Probably only informative for interdomain rotations greater than 20 degrees
Residue
iResidue
i+1Distance of hinge axis to residue i in
(A) Distance of hinge axis to residue i in
(A) Change in
(deg) Change in
(deg) Angle of psi(i) axis to hinge axis
(deg) Angle of psi(i) axis to hinge axis
(deg) Percentage Progress
LYS-316
TYR-317
6.0
5.9
4.2
-3.7
99.6
102.4
18.5
LYS-316
TYR-317
6.0
5.9
4.2
-3.7
99.6
102.4
18.5
TYR-317
ILE-318
3.7
3.9
11.0
-9.2
156.0
161.2
-11.1
ILE-318
ARG-319
1.6
2.1
-11.7
6.3
41.5
46.2
13.2

Graph shows rotational transition at bending residues and can be used
to identify hinge bending residues.
Probably only informative for interdomain rotations greater than 20 degrees