Adenylate Kinase Isoenzyme-2
(All numbering and residues are taken from first PDB file)
![]()
![]()
Bending Residue Dihedral Analysis
Residue
iResidue
i+1Distance of hinge axis to residue i in
(A) Distance of hinge axis to residue i in
(A) Change in
(deg) Change in
(deg) Angle of psi(i) axis to hinge axis
(deg) Angle of psi(i) axis to hinge axis
(deg) Percentage Progress
ARG-138
ARG-139
14.8
14.9
-5.4
3.3
98.2
101.0
10.8
ARG-139
ILE-140
11.5
11.6
-2.0
2.1
160.7
159.8
13.4
ILE-140
THR-141
11.7
11.7
5.7
1.9
73.4
71.9
24.0
THR-141
GLY-142
13.2
13.2
-17.6
6.5
62.0
68.7
55.2
GLY-142
ARG-143
11.7
11.8
26.0
-15.6
84.1
87.0
-46.5
ARG-143
LEU-144
8.1
8.2
4.8
0.5
73.0
75.3
80.8

Graph shows rotational transition at bending residues and can be used
to identify hinge bending residues.
Probably only informative for interdomain rotations greater than 20 degrees
Residue
iResidue
i+1Distance of hinge axis to residue i in
(A) Distance of hinge axis to residue i in
(A) Change in
(deg) Change in
(deg) Angle of psi(i) axis to hinge axis
(deg) Angle of psi(i) axis to hinge axis
(deg) Percentage Progress
TYR-153
HIS-154
3.0
3.2
-4.6
0.6
92.7
92.3
-46.7
HIS-154
GLU-155
6.4
6.6
2.5
0.5
20.3
20.3
79.2
GLU-155
GLU-156
8.0
8.2
-1.3
-5.1
135.9
137.2
-92.2
GLU-156
PHE-157
9.0
9.1
25.0
-19.4
95.3
91.9
-53.5
GLU-156
PHE-157
9.0
9.1
25.0
-19.4
95.3
91.9
-53.5

Graph shows rotational transition at bending residues and can be used
to identify hinge bending residues.
Probably only informative for interdomain rotations greater than 20 degrees
Residue
iResidue
i+1Distance of hinge axis to residue i in
(A) Distance of hinge axis to residue i in
(A) Change in
(deg) Change in
(deg) Angle of psi(i) axis to hinge axis
(deg) Angle of psi(i) axis to hinge axis
(deg) Percentage Progress
GLU-156
PHE-157
9.0
9.1
25.0
-19.4
95.3
91.9
-53.5
GLU-156
PHE-157
9.0
9.1
25.0
-19.4
95.3
91.9
-53.5
PHE-157
ASN-158
7.5
7.3
-7.5
2.8
88.9
87.2
1.1
ASN-158
PRO-159
3.7
3.5
-2.6
2.6
97.3
98.6
-15.4
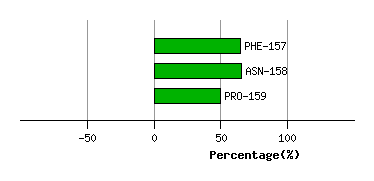
Graph shows rotational transition at bending residues and can be used
to identify hinge bending residues.
Probably only informative for interdomain rotations greater than 20 degrees
Residue
iResidue
i+1Distance of hinge axis to residue i in
(A) Distance of hinge axis to residue i in
(A) Change in
(deg) Change in
(deg) Angle of psi(i) axis to hinge axis
(deg) Angle of psi(i) axis to hinge axis
(deg) Percentage Progress
ILE-174
ARG-175
9.5
9.4
-1.5
4.5
104.0
104.6
-112.2
ARG-175
ARG-176
10.3
10.5
-0.5
-18.4
39.0
37.5
346.9
ARG-176
SER-177
9.6
9.8
-2.5
6.9
90.8
96.5
-67.1
SER-177
ASP-178
13.4
13.5
-23.3
19.2
25.4
39.0
44.3
ASP-178
ASP-179
13.8
14.3
40.7
-13.0
78.0
75.6
213.9

Graph shows rotational transition at bending residues and can be used
to identify hinge bending residues.
Probably only informative for interdomain rotations greater than 20 degrees