D-Galactose-Binding Periplasmic Protein
(All numbering and residues are taken from first PDB file)
![]()
![]()
Bending Residue Dihedral Analysis
Residue
iResidue
i+1Distance of hinge axis to residue i in
(A) Distance of hinge axis to residue i in
(A) Change in
(deg) Change in
(deg) Angle of psi(i) axis to hinge axis
(deg) Angle of psi(i) axis to hinge axis
(deg) Percentage Progress
VAL-108
GLY-109
14.7
14.4
-6.1
-15.4
91.7
90.7
-7.3
GLY-109
THR-110
11.2
11.0
-54.0
-2.5
73.5
50.5
97.3
THR-110
ASP-111
8.0
7.7
-36.5
29.1
7.0
66.0
-23.3
ASP-111
SER-112
6.4
6.5
39.9
-6.9
87.1
61.8
30.4
SER-112
LYS-113
5.9
5.7
14.5
1.8
114.9
118.3
-13.4
LYS-113
GLU-114
3.5
3.7
7.0
-9.9
64.5
72.2
-16.1

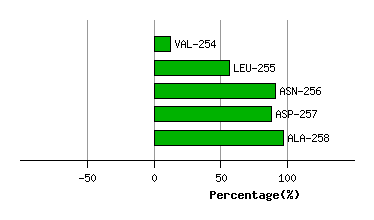
Graph shows rotational transition at bending residues and can be used
to identify hinge bending residues.
Probably only informative for interdomain rotations greater than 20 degrees
Residue
iResidue
i+1Distance of hinge axis to residue i in
(A) Distance of hinge axis to residue i in
(A) Change in
(deg) Change in
(deg) Angle of psi(i) axis to hinge axis
(deg) Angle of psi(i) axis to hinge axis
(deg) Percentage Progress
THR-253
VAL-254
7.2
7.4
-4.1
5.6
110.2
112.9
11.0
VAL-254
LEU-255
3.6
4.0
1.7
-22.2
126.0
120.4
43.9
LEU-255
ASN-256
0.6
1.1
3.8
14.0
56.8
50.8
34.8
ASN-256
ASP-257
3.2
2.7
-0.1
4.1
43.0
48.3
-2.7
ASP-257
ALA-258
5.1
5.2
-8.4
3.0
71.0
72.7
8.5
Graph shows rotational transition at bending residues and can be used
to identify hinge bending residues.
Probably only informative for interdomain rotations greater than 20 degrees
Residue
iResidue
i+1Distance of hinge axis to residue i in
(A) Distance of hinge axis to residue i in
(A) Change in
(deg) Change in
(deg) Angle of psi(i) axis to hinge axis
(deg) Angle of psi(i) axis to hinge axis
(deg) Percentage Progress
ARG-292
VAL-293
10.8
10.8
3.3
-8.8
53.0
36.4
-15.7
VAL-293
PRO-294
8.9
9.0
-22.0
2.9
76.4
81.1
7.4
PRO-294
TYR-295
6.3
6.4
-4.5
16.2
124.5
133.5
24.9
TYR-295
VAL-296
2.7
3.0
-1.6
10.4
96.0
99.8
37.4
VAL-296
GLY-297
4.1
5.0
-1.6
-3.2
102.5
105.6
4.9
GLY-297
VAL-298
5.7
6.7
-9.1
16.2
152.0
156.6
19.3

Graph shows rotational transition at bending residues and can be used
to identify hinge bending residues.
Probably only informative for interdomain rotations greater than 20 degrees